
On Wednesday, the GBP/USD continued decreasing significantly by 150 pips. The Cable depreciated from 1.5175 to 1.5026 yesterday, in line with the negative money flow sentiment at almost -26% and closing the day at 1.5043. The British Pound descended slightly further today, reaching 1.5012.
The downward channel has resumed on the 1 hour chart, while wide range trading has formed on the 3 hour chart. First resistance is yesterday's peak at 1.5175. Breaking above it should extend the bullish movement further towards 1.5300. The nearest support level is today's bottom at 1.5012. Going below it should extend the British Pound's reduction further down towards the next downward objective of 1.4890.
Data due today:U.K. GDP Q1 at 8:30 GMT.
Quotes are moving below the 20 and 50 EMA on the 1 hour chart, indicating bearish pressure. The value of the RSI indicator is negative and calm. MACD is negative and tranquil too, while the CCI has thinly crossed down the 100 line on the 1 hour chart, giving overall light short signals.
Technical resistance levels: 1.5175 1.5300 1.5434
Technical support levels: 1.5012 1.4890 1.4755
Already made +19 pips profit/loss on GBP/USD today from the following sent to clients only signal:
5:17 GMT+1 Sell GBP/USD at 1.5043 SL 1.5069 TP 1.4983, exit sent at 7:26 GMT+1.
Today so far +120, yesterday +177, as shown at our web site.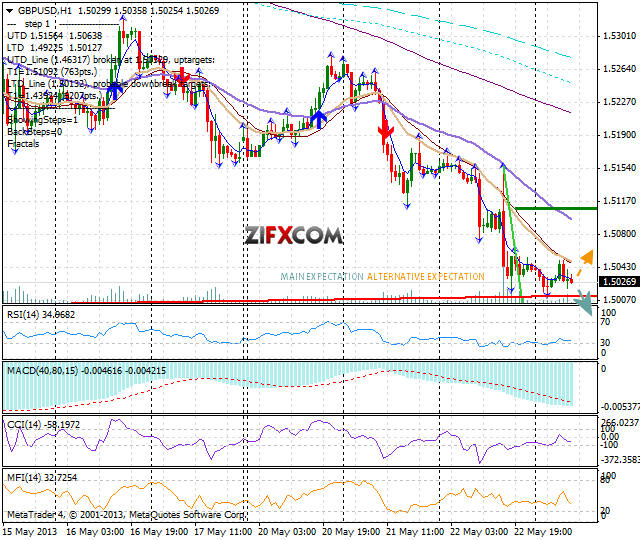 GBP/USD Chart" title="GBP/USD Chart">
- English (UK)
- English (India)
- English (Canada)
- English (Australia)
- English (South Africa)
- English (Philippines)
- English (Nigeria)
- Deutsch
- Español (España)
- Español (México)
- Français
- Italiano
- Nederlands
- Português (Portugal)
- Polski
- Português (Brasil)
- Русский
- Türkçe
- العربية
- Ελληνικά
- Svenska
- Suomi
- עברית
- 日本語
- 한국어
- 简体中文
- 繁體中文
- Bahasa Indonesia
- Bahasa Melayu
- ไทย
- Tiếng Việt
- हिंदी
GBP/USD Tumbles Down Towards 1.5
Published 05/23/2013, 03:30 AM
Updated 01/01/2017, 02:20 AM
GBP/USD Tumbles Down Towards 1.5
GBP/USD Open 1.5041 High 1.5175 Low 1.5012 Close 1.5043
Latest comments
Loading next article…
Install Our App
Risk Disclosure: Trading in financial instruments and/or cryptocurrencies involves high risks including the risk of losing some, or all, of your investment amount, and may not be suitable for all investors. Prices of cryptocurrencies are extremely volatile and may be affected by external factors such as financial, regulatory or political events. Trading on margin increases the financial risks.
Before deciding to trade in financial instrument or cryptocurrencies you should be fully informed of the risks and costs associated with trading the financial markets, carefully consider your investment objectives, level of experience, and risk appetite, and seek professional advice where needed.
Fusion Media would like to remind you that the data contained in this website is not necessarily real-time nor accurate. The data and prices on the website are not necessarily provided by any market or exchange, but may be provided by market makers, and so prices may not be accurate and may differ from the actual price at any given market, meaning prices are indicative and not appropriate for trading purposes. Fusion Media and any provider of the data contained in this website will not accept liability for any loss or damage as a result of your trading, or your reliance on the information contained within this website.
It is prohibited to use, store, reproduce, display, modify, transmit or distribute the data contained in this website without the explicit prior written permission of Fusion Media and/or the data provider. All intellectual property rights are reserved by the providers and/or the exchange providing the data contained in this website.
Fusion Media may be compensated by the advertisers that appear on the website, based on your interaction with the advertisements or advertisers.
© 2007-2024 - Fusion Media Limited. All Rights Reserved.