EUR/USD
The Euro enters near-term sideways mode following an upside rejection at 1.2576 and subsequent easing, which ended in yesterday’s close in red, but so far not making stronger impact on near-term price action, as fresh low at 1.2440, stays intact for now. Fresh bounce above 1.25 handle, signals that immediate downside risk is on hold. However, near-term tone remains negative, which suggests further consolidation, before fresh attempt lower, as overall picture is bearish. Daily 10EMA, which so far capped rallies, offers good resistance at 1.2571, with potential break here, expected to open breakpoints 1.2600, daily Tenkan-sen line and 1.2630, lower top of 30 Oct. Only break of the latter would neutralize risk of retesting 1.2440 and resumption of larger downtrend on a break.
Res: 1.2576; 1.2600; 1.2630; 1.2643
Sup: 1.2500; 1.2470; 1.2456; 1.2440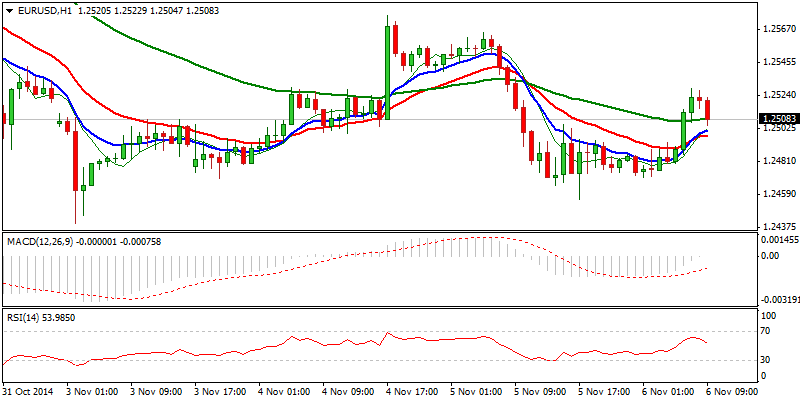
EUR/JPY
The pair remains firm and posted new 11-month high at 144.20, following yesterday’s fresh acceleration through psychological 144 barrier. The rally took out the last obstacles at 143.60/78, en-route towards next targets at 145.11, 2014 high and 145.67, 27 Dec 2012 seven-year peak. Initial support at 142.80, contained dips for now, with overbought 4-hour/daily conditions, signaling that further corrective easing cannot be ruled out. Stronger dips to be ideally contained at higher base at 141.68 and 141.45/20 Fibonacci 38.2% of 137.02/144.20 upleg / previous peak of 19 Sep.
Res: 143.43; 143.78; 144.00; 144.20
Sup: 142.80; 142.54; 142.00; 141.68 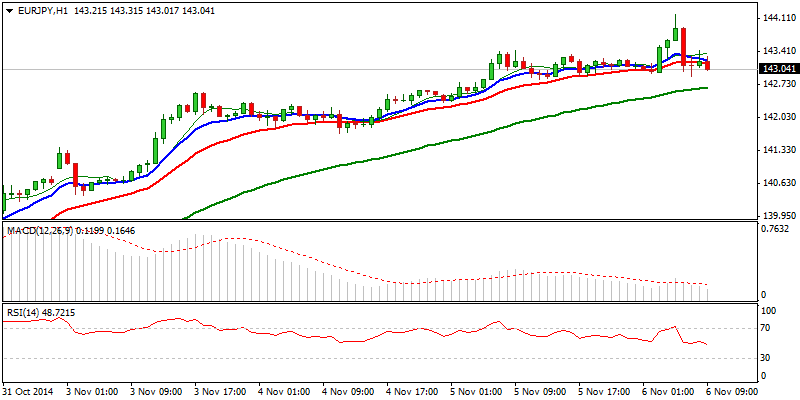
GBP/USD
The pair returned to 1.60 zone, after spike lower, which cracked key 1.5873 support, proved to be false break. Yesterday’s red candle with long lower wick, signals further hesitation for sustained break below 1.5900, weekly cloud base and 1.5873, 15 Oct low as magnetic 1.60 level continues to attract. Overall tone remains negative, with hourly studies being in neutral mode. On the upside, range tops / daily Tenkan-sen line and 50% of 1.6180/1.5867 downleg at 1.6025, offer strong resistance, with break and close above, to avert immediate downside risk, as short-term price action has established within 1.5870/1.6180 range. Otherwise, fresh attempts lower and close below 1.5867, would signal an eventual resumption of the downtrend from 1.7189, July 2014 peak, for test of 1.5750, June 2013 high and 1.5720, Fibonacci 61.8% of 1.4812/1.7189 ascend.
Res: 1.6000; 1.6025; 1.6037; 1.6052
Sup: 1.5953; 1.5923; 1.5900; 1.5867 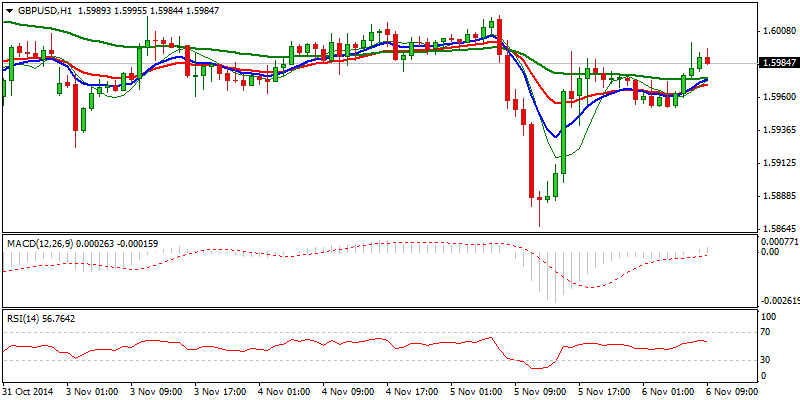
USD/JPY
The pair remains bullish overall, with fresh rally above psychological 115 barrier, posting new seven-year high at 115.50. Subsequent quick reversal, which found temporary footstep at 114 handle, could be seen as corrective action on strongly overbought 4-hour / daily studies. Overall bullish picture continues to focus the upside, with break above 115.50, to look for 117.95, Oct 2007 high and 120.26, Fibonacci 61.8% retracement of larger 147.68/75.55 descend, in extension. However, weakened hourly technicals cannot rule out further easing, with loss of 114 handle to signal stronger pullback towards 113.16 higher base and Fibonacci 23.6% of 105.18/115.49 upleg.
Res: 114.57; 115.00; 115.50; 116.00
Sup: 114.00; 113.50; 113.16; 113.00 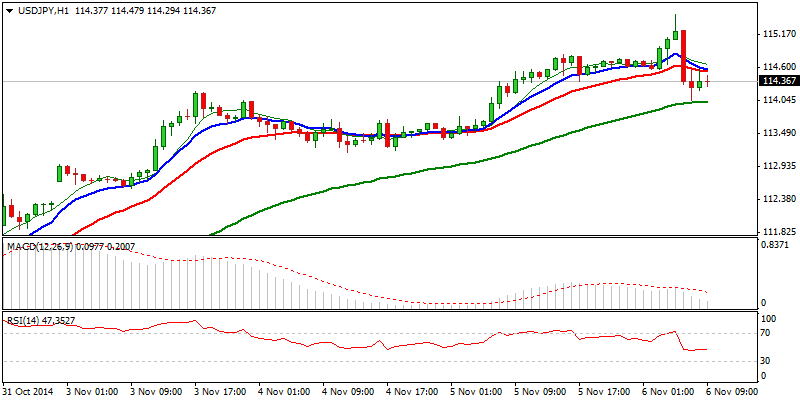
AUD/USD
The pair eventually ended short-term consolidation, with break below the range floor at 0.8641, triggering fresh weakness through 0.8600 handle, to come ticks away from its next target at 0.8543, 50% retracement of 0.6007/1.1079 ascend. Yesterday’s close in red and below psychological 0.86 barrier, confirms negative scenario. Former range floor at 0.8641 now offers strong resistance and should ideally cap corrective rallies on oversold near-term studies. Potential break and close above here would delay bears. Key near-term barriers and breakpoints lay at 0.8760 lower platform / highs of the week and 0.8800 psychological barrier.
Res: 0.8641; 0.8673; 0.8700; 0.8730
Sup: 0.8600; 0.8551; 0.8543; 0.8500 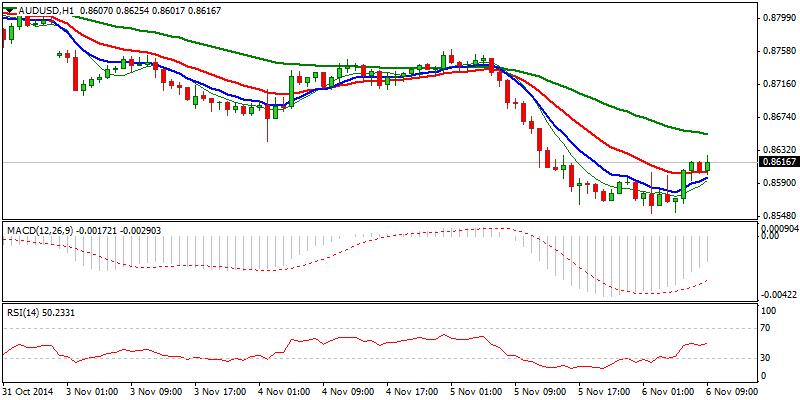
AUD/NZD
The pair remains under pressure and cracked 1.1100, psychological support / Fibonacci 61.8% of 1.0983/1.1301 upleg. Bounce from fresh low at 1.1088, is so far seen as corrective and preceding fresh push lower, as near-term studies are negative and sustained break below 1.11 handle, also daily cloud top, to open way for further easing and signal triple-top formation on 1.13 zone, Fibonacci 38.2% of 1.0619/1.1301 ascend at 1.1040, offers the next support, ahead of psychological 1.10 level, also 100SMA and higher base at 1.0980. Alternative scenario requires break and close above 1.12 barrier, near mid-point of 1.1301/1.1088 downleg, to sideline downside risk.
Res: 1.1156; 1.1182; 1.1200; 1.1220
Sup: 1.1100; 1.1088; 1.1040; 1.1000 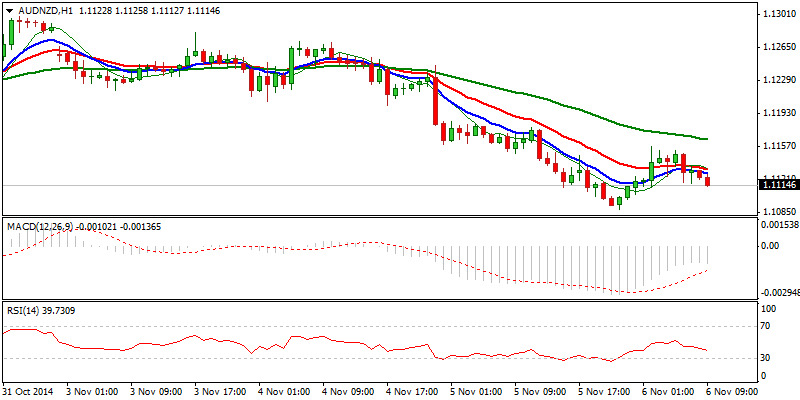
XAU/USD
Yesterday’s long red candle confirms resumption of the downtrend, as fresh acceleration lower met its next target at 1138, Fibonacci 161.8% projection. Bears remain in play on all timeframes and now look for psychological 1100 support, ahead of 1086, 50% retracement of larger 252/1920, 1999/2011 ascend. However, overextended conditions of larger timeframes studies, suggest that corrective action would likely precede fresh weakness. Former consolidation limits at 1161 and 1174, offers good resistance, ahead of former critical support and breakpoint at 1182, where stronger attempts higher should be limited.
Res: 1151; 1161; 1174; 1182
Sup: 1138; 1100; 1086; 1050 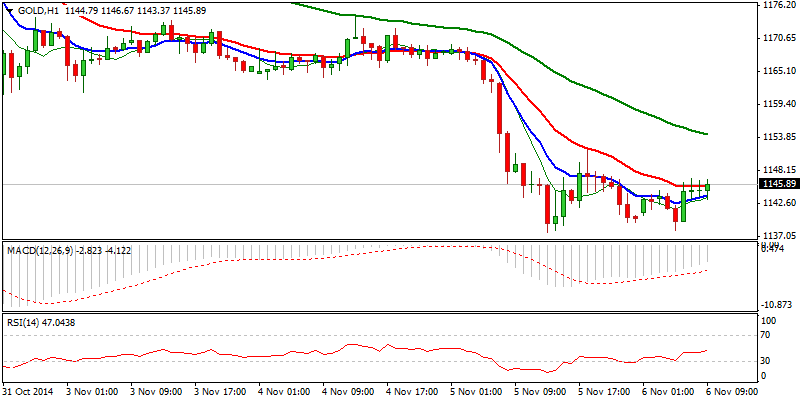
- English (UK)
- English (India)
- English (Canada)
- English (Australia)
- English (South Africa)
- English (Philippines)
- English (Nigeria)
- Deutsch
- Español (España)
- Español (México)
- Français
- Italiano
- Nederlands
- Português (Portugal)
- Polski
- Português (Brasil)
- Русский
- Türkçe
- العربية
- Ελληνικά
- Svenska
- Suomi
- עברית
- 日本語
- 한국어
- 简体中文
- 繁體中文
- Bahasa Indonesia
- Bahasa Melayu
- ไทย
- Tiếng Việt
- हिंदी
GBP/USD Returned To 1.60 Zone; USD/JPY Remains Bullish Overall
Published 11/06/2014, 03:41 AM
Updated 02/21/2017, 08:25 AM
GBP/USD Returned To 1.60 Zone; USD/JPY Remains Bullish Overall
Latest comments
Loading next article…
Install Our App
Risk Disclosure: Trading in financial instruments and/or cryptocurrencies involves high risks including the risk of losing some, or all, of your investment amount, and may not be suitable for all investors. Prices of cryptocurrencies are extremely volatile and may be affected by external factors such as financial, regulatory or political events. Trading on margin increases the financial risks.
Before deciding to trade in financial instrument or cryptocurrencies you should be fully informed of the risks and costs associated with trading the financial markets, carefully consider your investment objectives, level of experience, and risk appetite, and seek professional advice where needed.
Fusion Media would like to remind you that the data contained in this website is not necessarily real-time nor accurate. The data and prices on the website are not necessarily provided by any market or exchange, but may be provided by market makers, and so prices may not be accurate and may differ from the actual price at any given market, meaning prices are indicative and not appropriate for trading purposes. Fusion Media and any provider of the data contained in this website will not accept liability for any loss or damage as a result of your trading, or your reliance on the information contained within this website.
It is prohibited to use, store, reproduce, display, modify, transmit or distribute the data contained in this website without the explicit prior written permission of Fusion Media and/or the data provider. All intellectual property rights are reserved by the providers and/or the exchange providing the data contained in this website.
Fusion Media may be compensated by the advertisers that appear on the website, based on your interaction with the advertisements or advertisers.
© 2007-2025 - Fusion Media Limited. All Rights Reserved.
