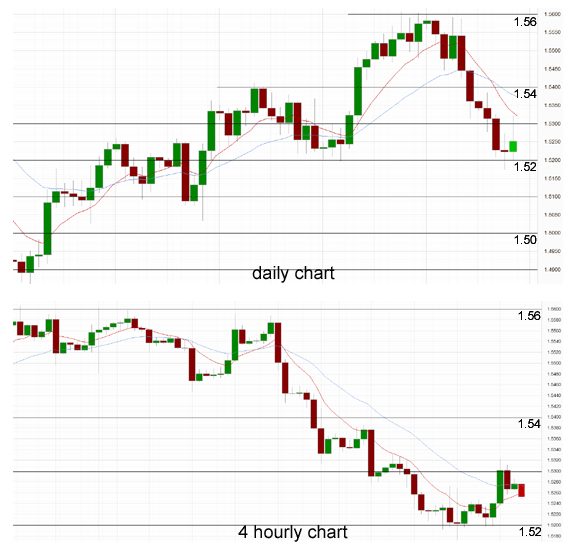
Over the last 24 hours the GBP/USD has started to show some signs of halting the recent decline by bouncing off support at 1.52 however it is presently trading lower from some resistance around 1.53. In the last 24 hours it has fallen below 1.52 and to levels not seen since early April. The pound has now experienced a strong fall over the last week or so. Prior to the last week, the pound has enjoyed a strong couple of weeks and move to new highs above 1.56. It experienced all sorts of bother at 1.56 as it made several pushes to this significant level however it was turned away with excessive supply. For about a week it ran into a wall of resistance right around the 1.56 level which is very evident in the 4 hourly chart below. This showed how much buying pressure there was on the 1.56 level but equally how well that level provided resistance to any movement higher. The pound had enjoyed a very solid couple of weeks moving from the support level at 1.52 to reach new highs at 1.56, a new ten week high.
It was only a few weeks ago, it found solid support at 1.52 for about a week which greatly assisted the recent surge higher, and now this level is being called upon again to offer some support and a soft landing. In the last 48 hours at least, we have seen evidence of that as the decline has been halted. The last week has seen the pound fall strongly and return almost all of its gains from the last few weeks. About a month ago the 1.54 level provided a little piece of resistance and this level has since been broken as it offered limited support. Now that the pound has drifted back down below 1.54, it may provide some resistance again. During its push to 1.56, the pound was able to find some support at 1.55, although this level has also been broken last week. Over the last month or so, the GBP/USD has been experiencing a variety of different levels which have played a role on the price action.
Towards the end of March the GBP/USD was trading within a range roughly between 1.51 and 1.5250 and now on a couple of occasions it has been able to move outside that range and push higher. A few weeks ago, the 1.5350 level was one of significance as it offered resistance before the GBP/USD was able to move higher through to 1.56. In early March the pound moved to new lows around 1.4830 from a starting point near 1.64 at the beginning of the year. With the surge higher over the last couple of months, the GBP/USD had completely turned around its fortunes from earlier in the year, however it is starting to ease off and return most of the good work.
In Europe, we’ve seen a lot of volatility from the euro recently, and one of the reasons has been statements from the ECB regarding negative deposit rates. Essentially, this means that depositors would be charged a fee for cash deposits held in European banks. ECB head Mario Draghi broached the idea earlier this month, and the euro dropped almost immediately. The reason? Negative deposit rates would lead to the flow of funds out of the Eurozone, as deposit holders seek better returns on their money. Earlier in the week, ECB member Ignazio Visco said that the ECB was open to the idea of negative deposits. Proponents of the idea argue that it would increase lending to businesses and help boost economic activity in the sluggish Eurozone. The ECB would be the first major central bank to adopt negative deposit rates, and if the ECB does take steps to adopt this measure, we can expect the euro to react.
GBP/USD May 17 at 02:50 GMT 1.5253 H: 1.5322 L: 1.5197 GBP/USD Technical" title="GBP/USD Technical" width="595" height="81">
During the early hours of the Asian trading session on Friday, the GBP/USD is consolidating a little after recently falling back below 1.53 and then rallying a little higher moving up away from 1.5260. Throughout the first part of this year, the pound fell very strongly from the key resistance level at 1.63 level down to levels not seen in two and a half years and has done well the last month to rally well and move back up above 1.56. Current range: Right around 1.5260.
Further levels in both directions:
• Below: 1.5200 and 1.5100.
• Above: 1.5600.
(Shows the ratio of long vs. short positions held for the GBP/USD among all OANDA clients. The left percentage (blue) shows long positions; the right percentage (orange) shows short positions.)
The GBP/USD long positions ratio has moved back up above 50% after the GBP/USD has fallen down to the three week low near 1.52. Trader sentiment remains in favour of long positions.
Economic Releases
- 12:30 CA CPI (Apr)
- 12:30 CA Wholesale Sales (Mar)
- 13:55 US Univ of Mich Sent. (Prelim.) (May)
- 14:00 US Leading Indicator (Apr)