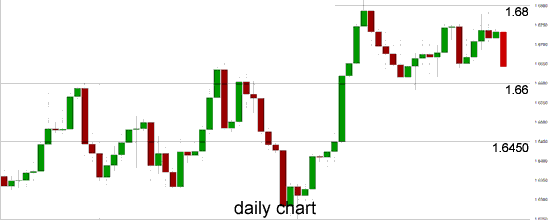
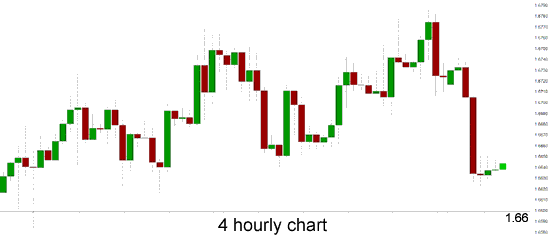
The last week or so has seen the GBP/USD edge higher back towards the short term resistance level at 1.6750 however in the last 24 hours it has fallen sharply and moved back below 1.6650. Just above the 1.6750 level is the resistance level at 1.68 which continues to loom large and is ready to offer an obstacle to higher prices should the pound rally again. Earlier last week the pound fell sharply away from the resistance level at 1.6750 and rest on a support level around 1.6650 before rallying higher again. Over the last few weeks the GBP/USD has received solid support from the key 1.66 level after it retraced strongly from the resistance level at 1.68 and over the last couple of weeks it had been edging higher slowly placing upwards pressure on a short term resistance level at 1.6750. In early February, the pound enjoyed a very healthy time moving well from the support level at 1.6250 through 1.6450 before pushing on to the multi-year high above 1.680.
In late January the pound fell sharply and experienced its worst one week fall this year which resulted in it moving to the six week low near the support level at 1.6250. Over the last few months the pound has established and traded within a trading range roughly around the key level of 1.6450, whilst moving down to support at 1.6250 and up to 1.66 and beyond. The 1.66 level has become quite significant and has loomed large throughout this year providing some resistance to higher prices. This level has resurfaced again as one of significance and it is now providing solid support. In late November it did well to break through the long term resistance level at 1.6250 which had established itself as a level of significance over the last few months. This level continues to play a role in providing support. In early November, the pound bounced strongly off the support level at 1.59 to return back to above 1.6250.
Towards the end of October the GBP/USD slowly drifted lower from the strong resistance level at 1.6250 and down to a three week low just around 1.5900 which was recently passed as the pound moved down towards 1.5850 only a week ago. For the week or so before that the pound moved well from the key level at 1.60 back up to the significant level at 1.6250, only again for this level to stand tall and fend off buyers for several days. Throughout September the pound rallied well and surged higher to move back up strongly through numerous levels which was punctuated by a push through to its highest level for the year just above 1.6250 several weeks ago. In the first week of October the pound was easing back towards 1.60 and 1.59 where it established a narrow trading range between before surging back to 1.6250 again.
The UK economy will exceed its pre-recession peak this summer, according to the latest predictions from British businesses, despite warnings that the recovery is on shaky foundations as a booming housing market stokes consumer confidence. The British Chambers of Commerce had forecast that GDP would overtake its performance in the first quarter of this year in the autumn, but has now brought that forward to the second quarter. Services and manufacturing have been the main drivers of growth according to official data, but the BCC warned that the buoyant outlook concealed long-term challenges. "We urge the chancellor to use this month's budget wisely by incentivising businesses to hire young people so that the next generation of workers are not left behind," said John Longworth, the director general of the BCC, which represents more than 100,000 businesses. According to the BCC, UK GDP - excluding the impact of inflation - will reach £392.8bn in the three months to July, a level not attained since the economy generated £392.7bn at the beginning of 2008.
 GBP/USD Daily Chart" title="GBP/USD Daily Chart" width="474" height="220">
 GBP/USD 4 Hourly Chart" title="GBP/USD 4 Hourly Chart" width="474" height="236">
GBP/USD March 11 at 01:50 GMT 1.6644 H: 1.6738 L: 1.6622
GBP/USD Technical
| S3 | S2 | S1 | R1 | R2 | R3 |
| 1.6600 | 1.6300 | 1.6250 | 1.6750 | 1.6800 | --- |
During the early hours of the Asian trading session on Tuesday, the GBP/USD is remaining very steady just below 1.6650 after falling sharply from above 1.67. Current range: Trading just below 1.6650 around 1.6640.
Further levels in both directions:
• Below: 1.6600, 1.6300, and 1.6250
• Above: 1.6750 and 1.6800.
OANDA's Open Position Ratios
(Shows the ratio of long vs. short positions held for the GBP/USD among all OANDA clients. The left percentage (blue) shows long positions; the right percentage (orange) shows short positions.)
The GBP/USD long positions ratio has moved back below 30% again as the GBP/USD remains steady around 1.6650 again. Trader sentiment remains in favour of short positions.
Economic Releases
- 00:01 UK BRC Retail Sales Monitor (Feb)
- 00:30 AU NAB Business Conditions (Feb)
- 00:30 AU NAB Business Confidence (Feb)
- 09:30 UK Industrial Production (Jan)
- 09:30 UK Manufacturing Production (Jan)
- 14:00 US Wholesale Inventories (Jan)
- JP BoJ MPC - Overnight Rate (Mar)
