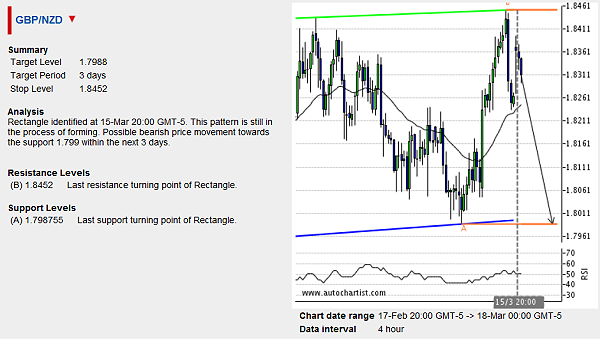
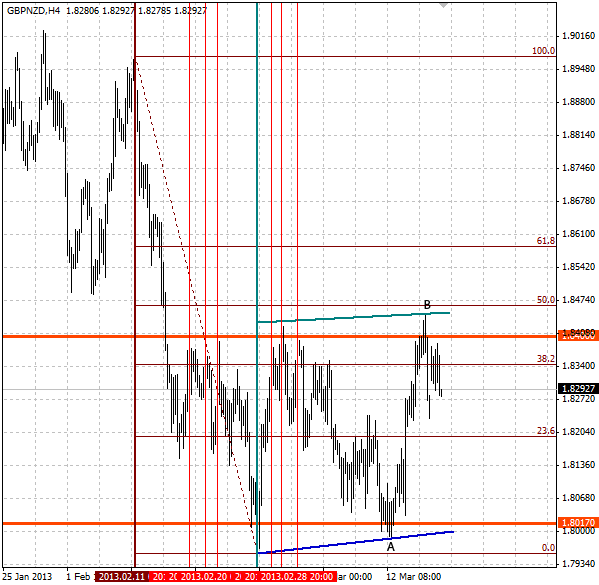
GBP/NZD has been falling in accordance with the following trade opportunity alert that I received recently via Autochartist’s email subscription. The pair is expected to fall to the target level 1.7988 in the next 3 trading days. The target level for this bearish forecast 1.7988 (point A on the chart below) stands at the level of the last upward reversal point of the 4-hour Rectangle chart pattern identified by Autochartist (which is still being formed). The stop-level (point B) is set at 1.8452, which corresponds to the last downward reversal pivot of this Rectangle. This point formed recently when the pair reversed down from the combined resistance area made out of the round resistance level 0.8400 (which has reversed the pair multiple times in the last month) and the 50% Fibonacci Retracement of the preceding sharp downward price impulse from the start of February – as is shown on the second chart below.
 GBP/NZD" title="GBP/NZD" width="600" height="339" />
The following 4-hour GBP/NZD chart displays the aforementioned technical price levels:
 GBP/NZD H4" title="GBP/NZD H4" width="599" height="585" />
 GBP/NZD" title="GBP/NZD" width="600" height="339" />
The following 4-hour GBP/NZD chart displays the aforementioned technical price levels:
 GBP/NZD H4" title="GBP/NZD H4" width="599" height="585" />