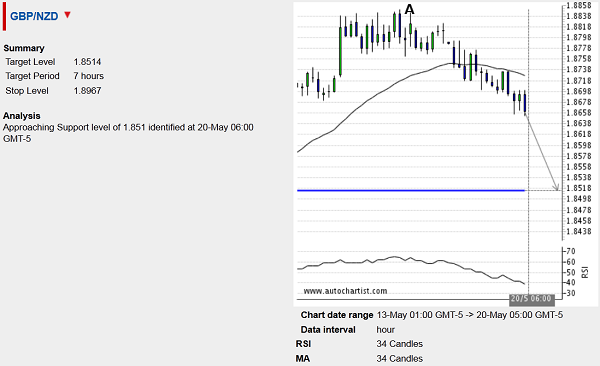
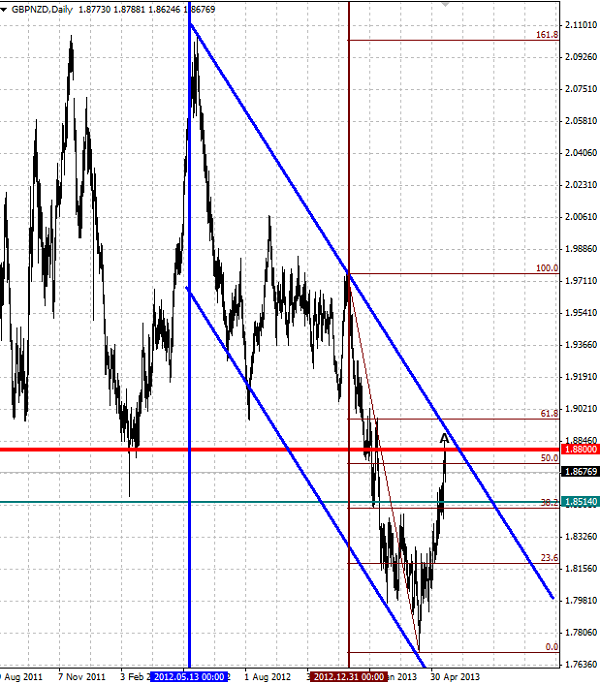
GBP/NZD continues to fall toward the Key Support Level 1.8514 (of the type Approach) identified by Autochartist on the hourly charts – as you can see from the following trade opportunity alert that I received recently for this currency pair through Autochartist’ email subscription. The pair recently corrected down (at point A) from the resistance area made out of the round resistance level 1.8800, 50% Fibonacci Retracement of the preceding downward price impulse from the end of last year as well as the upper resistance trendline of the longer-term Down Channel from the middle of 2012 (as you can see on the second daily GBP/NZD chart below). Expect the pair to reach the target level 1.8514 in the next 7 hours. GBP/NZD - 1" title="GBP/NZD - 1" width="600" height="366">
The following daily GBP/NZD chart shows the resistance price levels mentioned above: GBP/NZD - 2" title="GBP/NZD - 2" width="600" height="685">
- English (UK)
- English (India)
- English (Canada)
- English (Australia)
- English (South Africa)
- English (Philippines)
- English (Nigeria)
- Deutsch
- Español (España)
- Español (México)
- Français
- Italiano
- Nederlands
- Português (Portugal)
- Polski
- Português (Brasil)
- Русский
- Türkçe
- العربية
- Ελληνικά
- Svenska
- Suomi
- עברית
- 日本語
- 한국어
- 简体中文
- 繁體中文
- Bahasa Indonesia
- Bahasa Melayu
- ไทย
- Tiếng Việt
- हिंदी
GBP/NZD Continues to Fall
Published 05/21/2013, 05:10 AM
Updated 03/09/2019, 08:30 AM
GBP/NZD Continues to Fall
Latest comments
Loading next article…
Install Our App
Risk Disclosure: Trading in financial instruments and/or cryptocurrencies involves high risks including the risk of losing some, or all, of your investment amount, and may not be suitable for all investors. Prices of cryptocurrencies are extremely volatile and may be affected by external factors such as financial, regulatory or political events. Trading on margin increases the financial risks.
Before deciding to trade in financial instrument or cryptocurrencies you should be fully informed of the risks and costs associated with trading the financial markets, carefully consider your investment objectives, level of experience, and risk appetite, and seek professional advice where needed.
Fusion Media would like to remind you that the data contained in this website is not necessarily real-time nor accurate. The data and prices on the website are not necessarily provided by any market or exchange, but may be provided by market makers, and so prices may not be accurate and may differ from the actual price at any given market, meaning prices are indicative and not appropriate for trading purposes. Fusion Media and any provider of the data contained in this website will not accept liability for any loss or damage as a result of your trading, or your reliance on the information contained within this website.
It is prohibited to use, store, reproduce, display, modify, transmit or distribute the data contained in this website without the explicit prior written permission of Fusion Media and/or the data provider. All intellectual property rights are reserved by the providers and/or the exchange providing the data contained in this website.
Fusion Media may be compensated by the advertisers that appear on the website, based on your interaction with the advertisements or advertisers.
© 2007-2025 - Fusion Media Limited. All Rights Reserved.
