GBP/JPY: An Important Pair To Watch
 GBP/JPY Daily Chart" title="GBP/JPY Daily Chart" width="474" height="242">
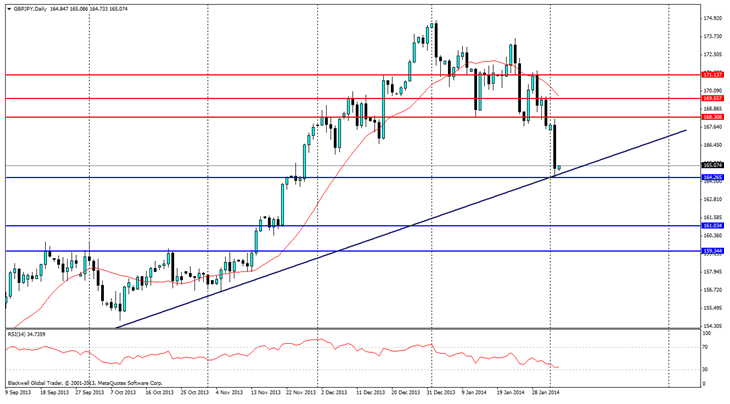
Market technicals are looking very appealing as the GBP/JPY pair falls down to a strong bullish line. This movement has been led in part by very strong fundamentals as well as a push away to risk aversion strategies; as investors look to hold yen in the long run as it offers a safe haven in trying times.
So why the sudden downfall for the GBP/JPY pair. Well, last week UK GDP data was well within expectations. But mortgage approvals were lower than expected, showing some weakness, additionally the Euro-zone deflation threat also weighed on the currency as well.
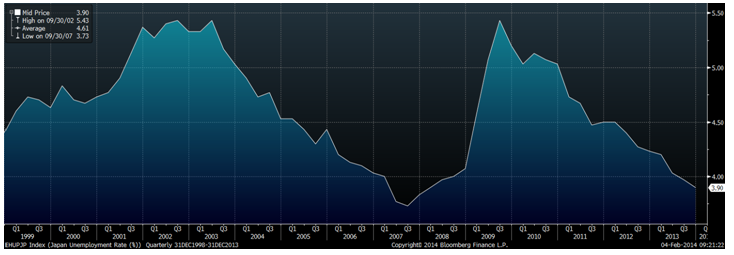
The yen however continued to strengthen as recent data out last week showed in effect that Abenomics is indeed working. CPI for the year lifted to 1.6%, a major achievement given the recent history of Japan’s economy. Additionally, unemployment fell to 3.7%, an extremely low figure in the developed world, but one that is showing that Japan’s economic situation is ultimately improving overall.

Market resistance levels can be found at 166.214, 168.308, 169.557, and 171.137 for the pair. With 166.214 likely to be the most tested level if there is movement upwards. While support levels are very thin at 164.265, 161.034 and 159.344, these look unlikely to be tested unless there is a breakthrough for the bullish trend line in play. When looking at trading, it’s important to note the trend line will act as dynamic support if the uptrend continues.
The RSI is showing heavy selling pressure against the pound, but that’s not to say it’s a done thing and the trend line will break. The trend line is very solid and has been tested since June 2013, and has yet to see anything break through.
Overall, I believe the GBP/JPY pair is the most important to watch in the coming 24 hours. There is certainly the chance for a pullback, but any breakthrough should be treated as a strong bearish signal to trade off.
