Talking Points:- Dual Lines of Resistance in Play for GBP/JPY
- Key Zone for Initiating New Shorts
- The Ideal Time Frame for Taking This Trade
Mondays of late tend to be characterized by rather lazy price action, and this Monday looks to be no different. However, traders might be able to pull off an intraday trade in GBP/JPY should it retest the highs of the day.
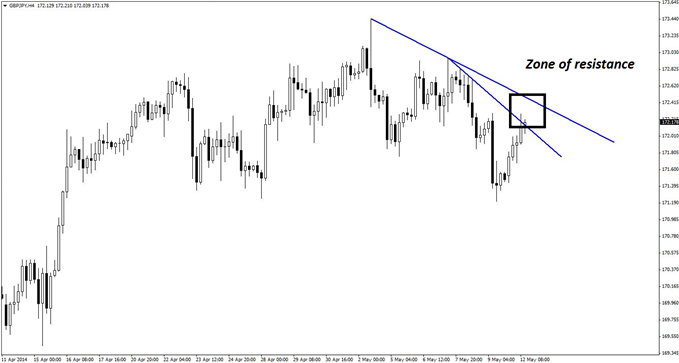
The story begins on the four-hour chart below, where price is now rising to challenge two declining lines of resistance. Normally, one would respect the longer-term uptrend, but this has to be considered in light of two potentially mitigating factors:
- There are dual lines of declining resistance in close proximity to each other; and…
- Mondays tend to be mean reverting
In all, a somewhat countertrend trade could be considered, one that requires extremely defensive trade management.
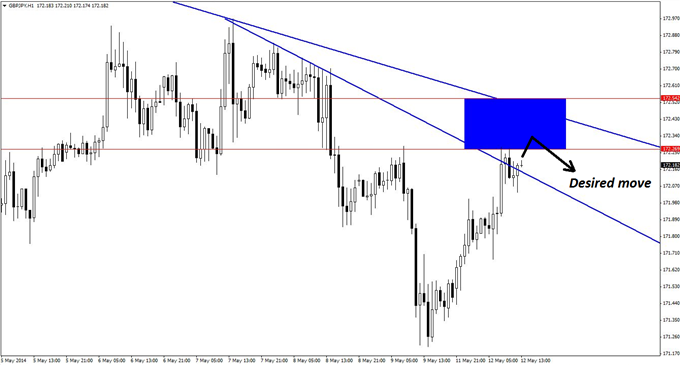
The resistance zone is readily found using the space between these two lines of resistance, and while different traders will have drawn different trend lines with varying degrees of slope, most lines will fall within the highlighted zone on the below hourly chart. In addition, there are lines of previous horizontal support and resistance that lend further credence to these levels.
The exact zone is 172.26-172.54. Price has already come up to test this area once, although this only provoked a lukewarm response from sellers thus far. Hence, it would be wiser to expect another upward push by the bulls before selling starts in earnest.
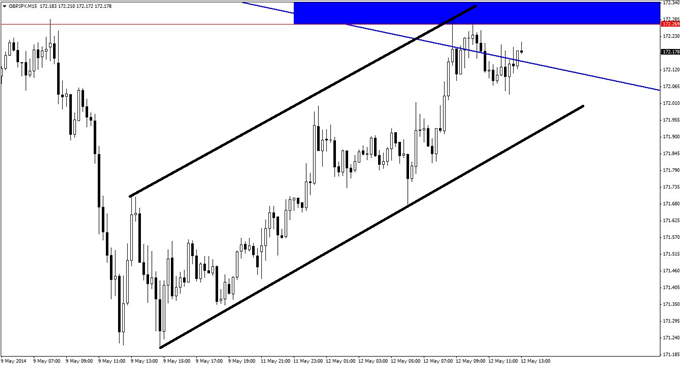
The ideal scenario would be for price to make a new high before entering on the 15-minute chart (see below). Triggers including bearish reversal divergence (preferred), bearish engulfing patterns, and/or pin bars would all serve as valid short-entry signals.
Should the trade work out, there could be 100 pips to be had as price heads down to retest the recent low. By comparison, the 28-pip risk zone seems small, and the 15-minute chart could likely produce even smaller risk.
A rough parallel channel can be seen on below the 15-minute chart. In situations of this sort, price is bouncing with approximately equal strength up and down, or at least it has been up to this point. By following the price action on the chart, one can see that a new downward push seems to be in the early stages right now. Thus, the most opportune place to enter would be if there is one last swipe to the high.
Of course, this may not happen, and the trade may not mature. However, if it does, it could prove quite worthwhile. As always, traders should be prepared to enter two or three times in order to get in on the move.
Also, as this move is opposite in nature to the larger trend, there should be multiple positions taken in order to better control risk. For that very same reason, part of the position should be exited relatively quickly, while the remainder can be left to run if this turns out to be the beginning of a longer swing down.
By Kaye Lee, private fund trader and head trader consultant, StraightTalkTrading.com.


