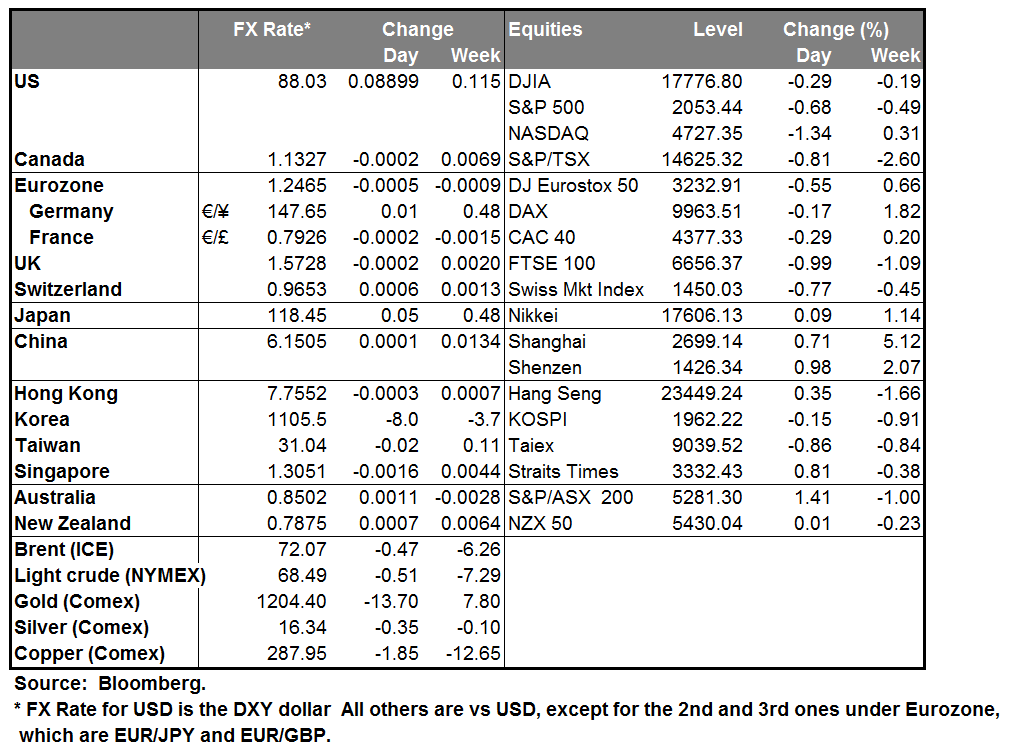
RBA remains on hold The Reserve Bank of Australia kept the official cash rate unchanged, as was universally expected, and repeated that the exchange rate “remains above most estimates of its fundamental value.” In the statement accompanying the decision, the Bank said that recent data on prices confirmed that inflation is running between their 2%-3% but unlike their previous statement they seemed less confident that this is likely to continue. The change in their stance may be attributed to the lower oil prices. On the other hand, they kept their concerns over the labor market which has some time yet before it declines consistently. AUD/USD strengthened following the decision but the move was halted just below 0.8530. The pair has depreciated approximately 2.3% since their last meeting and seems not enough to tone down their comments over an overvalued rate. As mentioned in the statement “A lower exchange rate is likely to be needed to achieve balanced growth in the economy”. The decline in iron ore prices and the downward pressure on prices from the falling oil give me enough reasons to remain bearish on AUD.
As for the country’s data releases ahead of the policy meeting, the current account deficit narrowed a bit in Q3 while building approvals rebounded strongly in October. Both releases exceeded estimates, yet they had a limited impact on the rate that traded stable until the rate decision.
With no other major economic releases overnight, USD remained subdued against most of its peers. It was lower the most against NOK and CAD, which gained following the moderate rebound in oil prices.
On Monday, Moody’s Investors Service downgraded Japan’s credit rating, citing heightened uncertainty over the country’s ability to cut its fiscal deficit after Prime Minister Shinzo Abe decided to delay the next tax increase scheduled to take effect next year. Moody’s downgraded Japan’s debt by one notch to A1 from Aa3, the first downgrade since 2011. USD/JPY surged to a seven-year high of 119.14 following the downgrade, but fell immediately to trade at lower levels than before the announcement and moved sideways since then. Despite the move lower, we maintain our long-term USD/JPY bullish view and could see the current setback as providing renewed buying opportunity.
As for today’s activity, we have a relatively quiet calendar day: Eurozone’s PPI for October is expected to fall at a decelerating pace, still indicating that the deflation risk persists in the region.
From the UK, construction PMI for November is expected to decline a bit. Although it is expected to remain above the 50 level, the overall decline could be attributed to the tighter lending conditions as seen in mortgage approvals released on Monday.
As for the speakers, Fed Chair Janet Yellen gives welcoming remarks to students in Washington and Fed Vice Chairman Stanley Fischer speaks again. Fischer along with the New York President William Dudley who spoke on Monday at separate events, stressed the positive impact from the low oil prices. As for the concerns that lower oil prices will lead to lower inflation, Fed Vice Chairman Fischer said that this is going to be temporary.
The Market
EUR/USD slightly higher
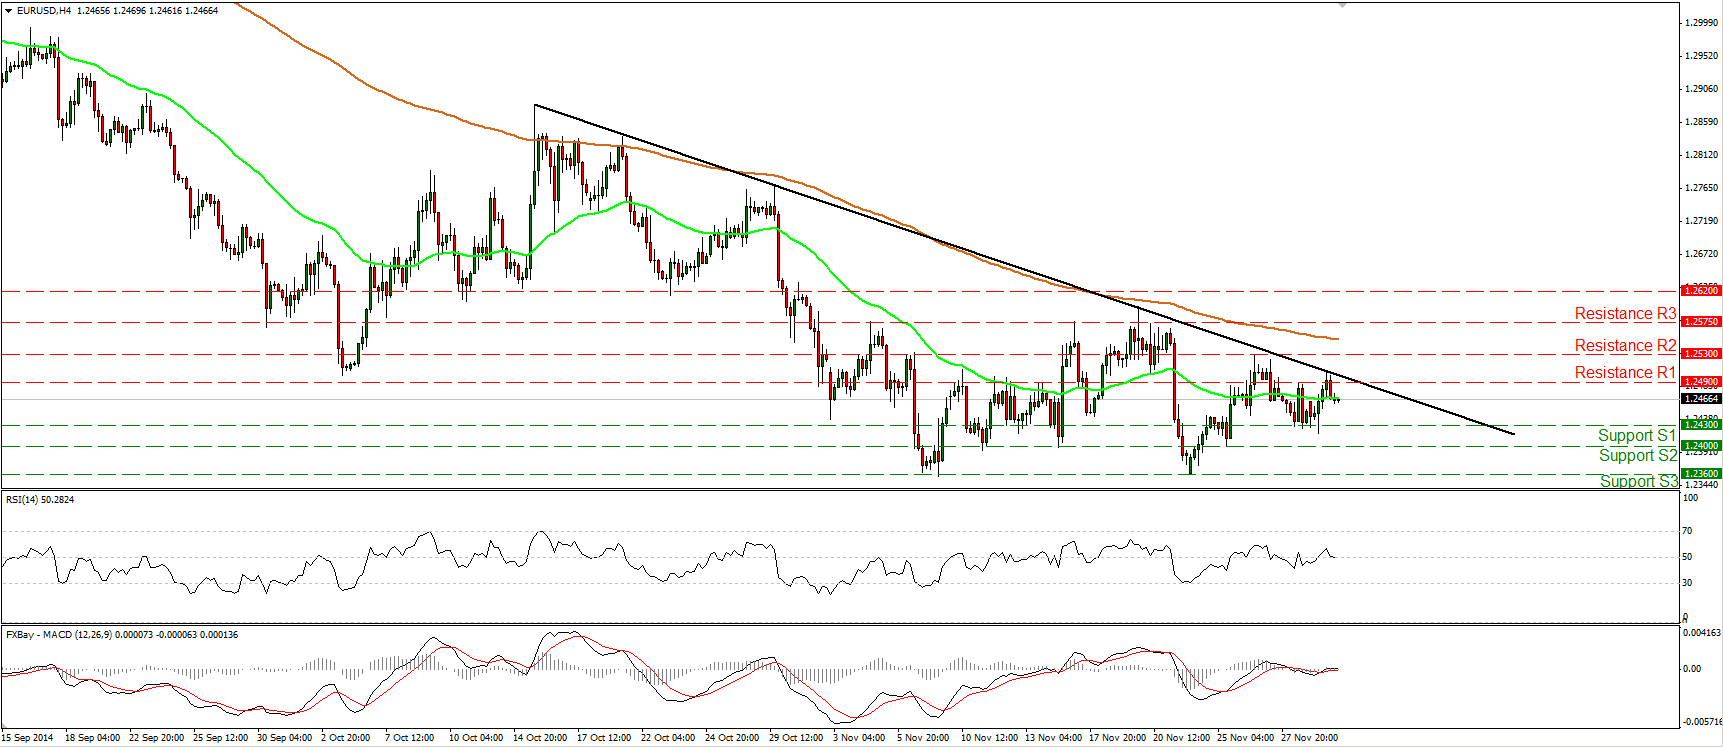
EUR/USD moved slightly higher yesterday but the advance was halted by the black downtrend line taken from back at the high of the 15th of October. As long as the rate stays below that trend line I would still see a negative near-term picture. On the daily chart, the overall trend of EUR/USD stays to the downside, but given the positive divergence between our daily oscillators and the price action, I would prefer to see a decisive dip below 1.2360 (S3) before getting more confident on longer-term downtrend. Such a break is likely to pave the way for the 1.2250 area, defined by the lows of August 2012.
• Support: 1.2430 (S1), 1.2400 (S2), 1.2360 (S3).
• Resistance: 1.2490 (R1), 1.2530 (R2), 1.2575 (R3).
AUD/USD still within a downside channel
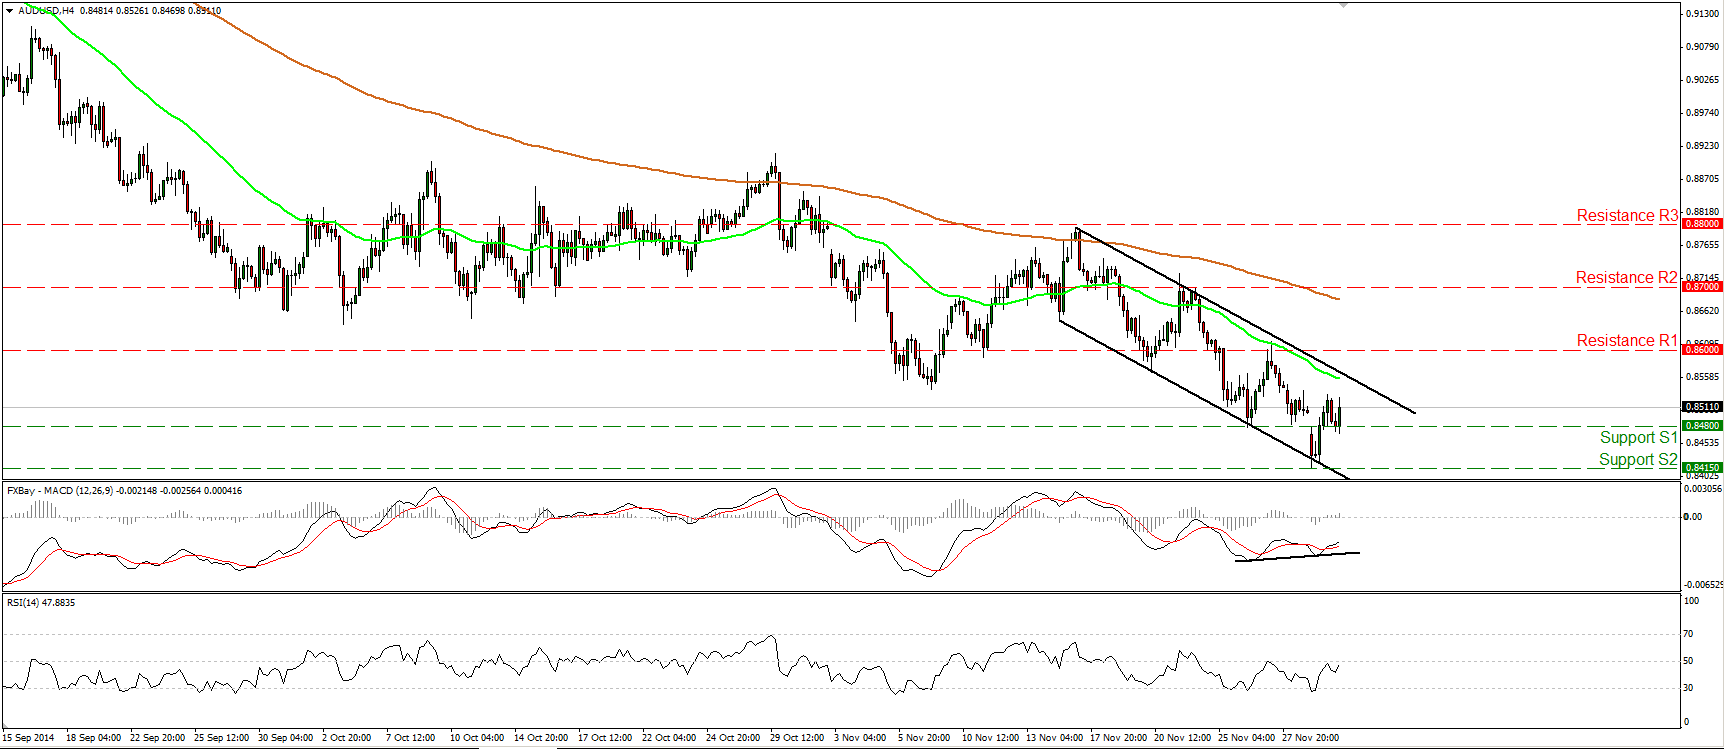
AUD/USD moved higher after finding support at the 0.8415 (S2) barrier and the lower boundary of the black downside channel. As long as the rate is printing lower peaks and lower troughs within that near-term downside channel, I consider the short-term picture to be negative, and I still expect AUD/USD to challenge the 0.8300 (S3) area, defined by the lows of July 2010, in the not-to-distant future. Nevertheless, taking a look at our momentum studies I would stay cautions that yesterday’s rebound may extend a bit more. The RSI is pointing up and appears able to challenge its 50 line any time soon, while the MACD, although below zero, has crossed above its trigger line. I can also spot positive divergence between the MACD and the price action. On the daily chart, since the rate remains below both the 50- and 200- day moving averages, I still see a longer-term downtrend.
• Support: 0.8480 (S1), 0.8415 (S2), 0.8300 (S3).
• Resistance: 0.8600 (R1), 0.8700 (R2), 0.8800 (R3).
Gold shoots up
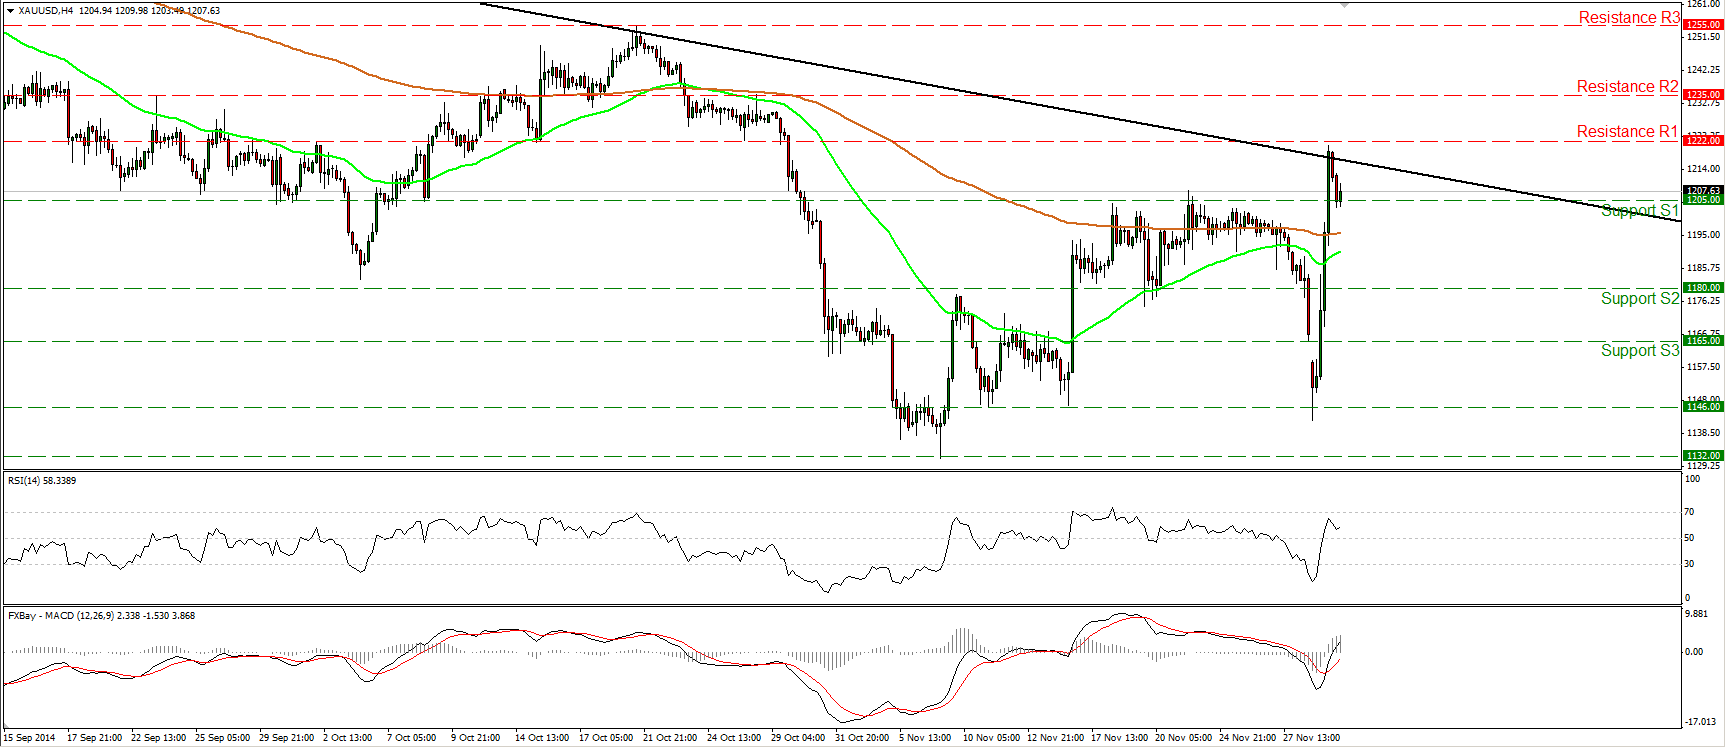
Gold shot up yesterday ignoring three resistance barriers in a row. The rally was halted marginally below our resistance hurdle of 1222 (R1) and the metal pulled back to find support near 1205 (S1). With no clear trending conditions in the near-term I would prefer to adopt a neutral stance for now. A dip below 1205 (S1) is likely to extend the pullback, perhaps towards 1180 (S2). On the other hand, a move above 1222 (R1) could set the stage for another upside leg and target our resistance of 1235 (R2). On the daily chart, the yellow metal found resistance near the downtrend line taken from back the high of the 10th of July, and this keeps the longer-term downtrend intact. However, the 14-day RSI moved back above its 50 line, while the daily MACD, already above its trigger, appears ready to challenge its zero line in the close future. These momentum signs give me extra reasons to sit on the sidelines, at least for now.
• Support: 1205 (S1), 1180 (S2), 1165 (S3).
• Resistance: 1222 (R1), 1235 (R2), 1255 (R3).
WTI corrects higher
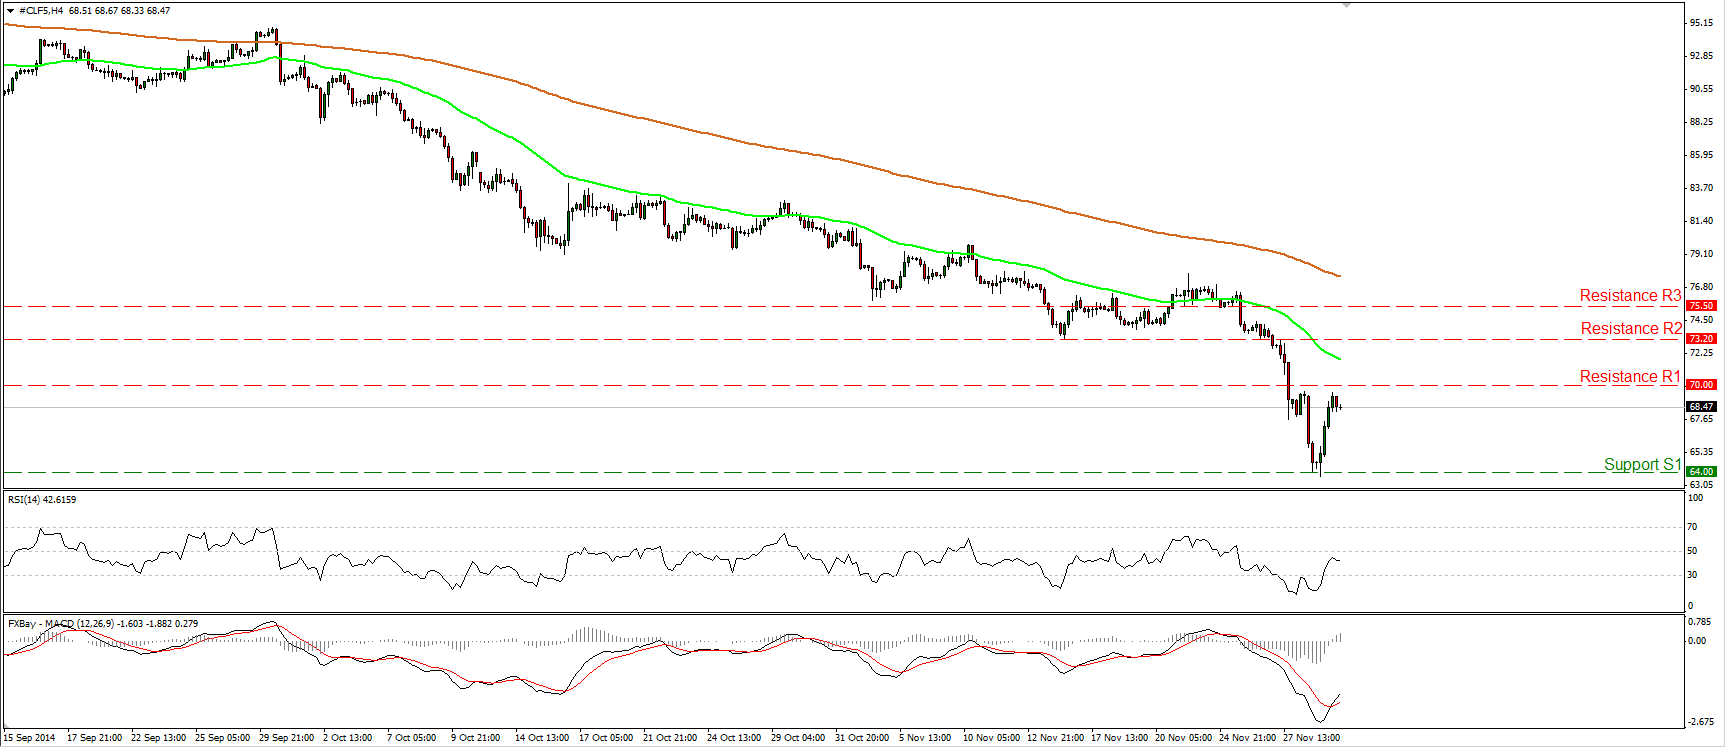
WTI rebounded on Monday and today, during the early European morning, it is trading slightly below the psychological line of 70.00. Taking a look at our momentum studies, I would stay cautious that the rebound may continue a bit more. The RSI exited its oversold territory and moved higher, while the MACD, although negative, has bottomed and moved above its signal line. However, on the daily chart, the price structure remains lower peaks and lower troughs below both the 50- and the 200-day moving averages, which keeps the overall path of WTI to the downside. Therefore, I would expect the yesterday’s rebound or any extensions of it to provide renewed selling opportunities.
• Support: 64.00 (S1), 62.70 (S2), 60.00 (S3).
• Resistance: 70.00 (R1), 73.20 (R2), 75.50 (R3).
GBP/JPY breaks above 186.00
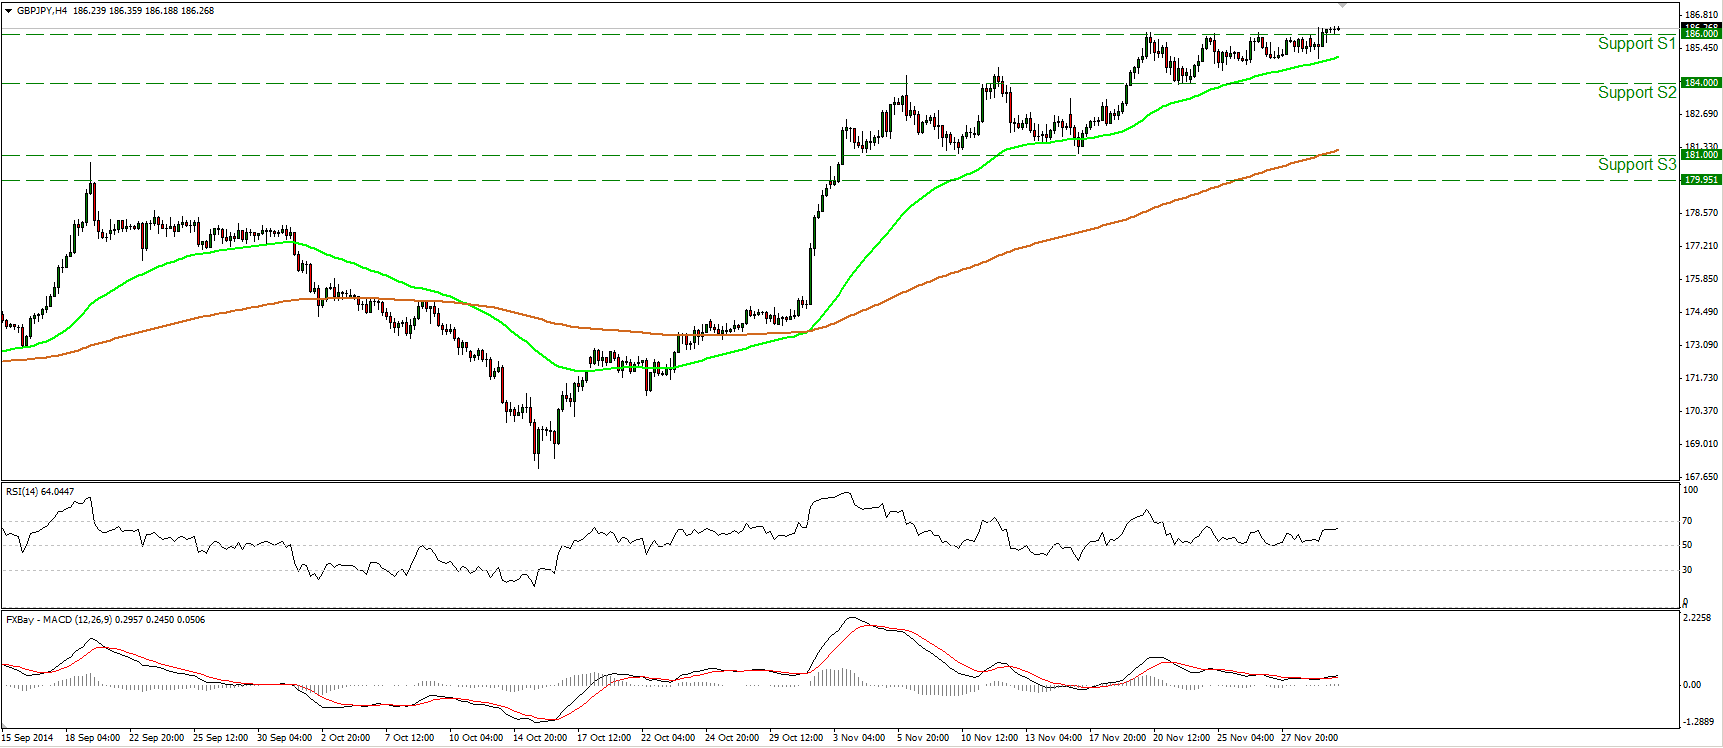
GBP/JPY moved slightly higher on Monday and broke above the resistance (turned into support) line of 186.00 (S1). In my view, such a break could open the way towards the resistance area of 189.00 (R1) hurdle, near the highs of the 3rd of October 2008. Our near-term momentum studies maintain a positive tone. The RSI moved higher after finding support near its 50 line, while the MACD has topped marginally above zero and poked its nose above its trigger line. These signs designate bullish momentum. As long as the pair is trading above both the 50- and the 200-period moving averages, I would consider the overall trend of GBP/JPY to stay to the upside.
• Support: 186.00 (S1), 184.00 (S2), 181.00 (S3).
• Resistance: 189.00 (R1), 190.00 (R2), 192.00 (R3).

