GBP Higher As Brexit Rules

Published 10/11/2019, 12:36 AM
Updated 08/22/2024, 06:01 PM

The British Pound is higher against most G-10 currencies after UK Prime Minister Boris Johnson and Ireland Taoiseach Leo Varadar met today. The 2 leaders declared they had a positive meeting and that a deal for an orderly Brexit can be done by the end of the month! Although GDP, Industrial Production, and manufacturing data out of the UK were worse than expected, Brexit continues to rule the markets.
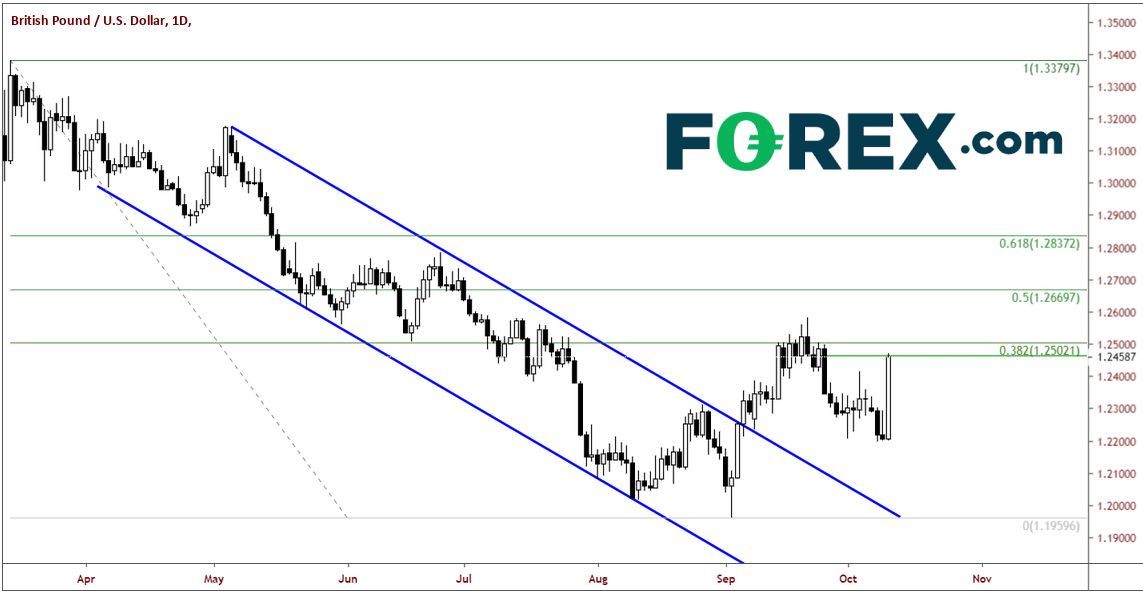
GBP/USD Daily Chart

GBP/USD closed up nearly 250 pips on the day, or 2.0%. The pair halted its ascent at the September 20th lows and horizontal resistance and the lows at 1.2460. The 38.2% Fibonacci retracement level from the March 13th high to the September 3rd low sits just above at 1.2500. However, be aware that if a Brexit deal looks more and more likely to get done, GBP/USD could be at 1.3400 in an instant.

On a 240-minute chart, support is down at 1.2413. Next support is at 1.2335, which is a 50% retracement of today’s move. Don’t read too much into the RSI on the 240 minutes chart, as they tend not to be as reliable during fast markets.
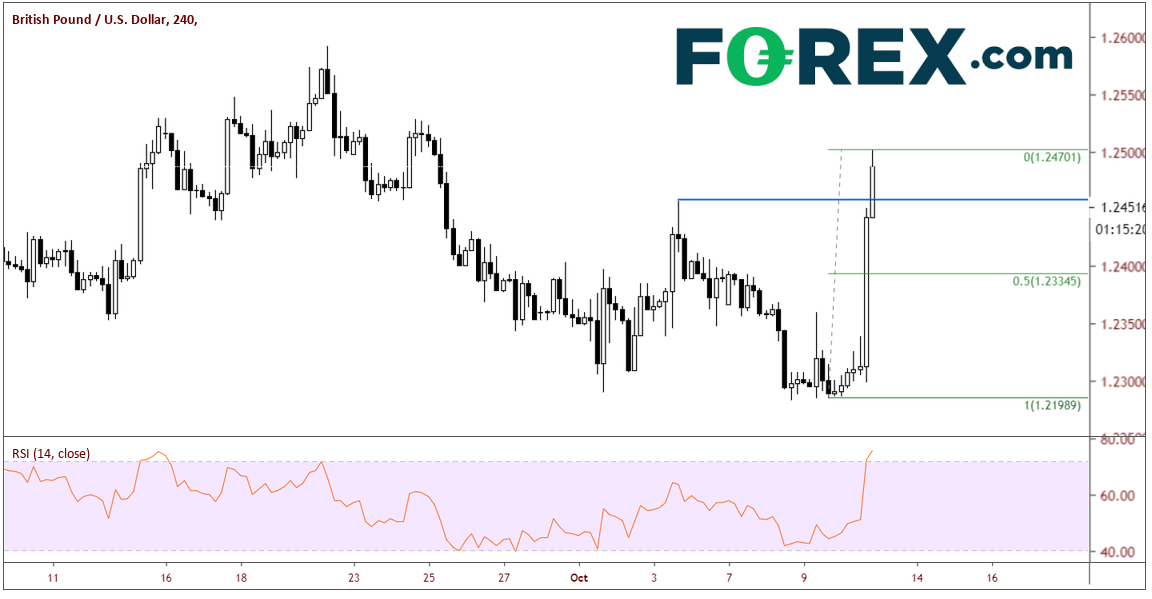
GBP/USD 240 Minute Chart

After bouncing around for a few months between the 38.2% Fibonacci retracement level and the 61.8% Fibonacci retracement level from the May 6th lows to the August 12th highs, EUR/GBP ran right into horizontal resistance at .9018 and fell off dramatically from there. Price is back the bottom of the range, closing down 1.7% on the day. First support is the September 20th lows near .8786. Below that, horizontal support comes in at .8982.

Euro/GBP Daily Chart
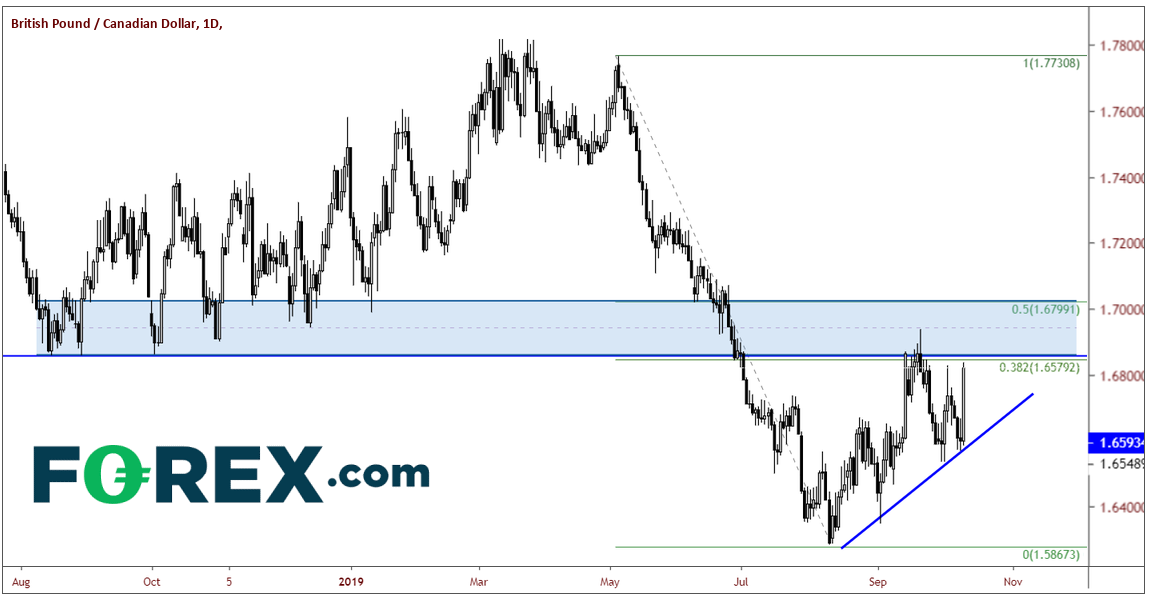
GBP/CAD Daily Chart

GBP/CAD also traded higher, up 1.8%, near 1.6563. This is just below horizontal resistance and the 38.2% Fibonacci retracement level from the May 3rd high to the August 8th low at 1.6579. There is actually a large resistance zone between the 38.2% and 50% Fibonacci retracement levels, as there are a number of prior lows in that area, which now act as resistance. First support comes in at 1.6403, which is 50% of today’s trading range. Below that, horizontal and trendline support come in near 1.6336.

Original Post

Latest comments

Loading next article…
Risk Disclosure: Trading in financial instruments and/or cryptocurrencies involves high risks including the risk of losing some, or all, of your investment amount, and may not be suitable for all investors. Prices of cryptocurrencies are extremely volatile and may be affected by external factors such as financial, regulatory or political events. Trading on margin increases the financial risks.
Before deciding to trade in financial instrument or cryptocurrencies you should be fully informed of the risks and costs associated with trading the financial markets, carefully consider your investment objectives, level of experience, and risk appetite, and seek professional advice where needed.
Fusion Media would like to remind you that the data contained in this website is not necessarily real-time nor accurate. The data and prices on the website are not necessarily provided by any market or exchange, but may be provided by market makers, and so prices may not be accurate and may differ from the actual price at any given market, meaning prices are indicative and not appropriate for trading purposes. Fusion Media and any provider of the data contained in this website will not accept liability for any loss or damage as a result of your trading, or your reliance on the information contained within this website.
It is prohibited to use, store, reproduce, display, modify, transmit or distribute the data contained in this website without the explicit prior written permission of Fusion Media and/or the data provider. All intellectual property rights are reserved by the providers and/or the exchange providing the data contained in this website.
Fusion Media may be compensated by the advertisers that appear on the website, based on your interaction with the advertisements or advertisers.
© 2007-2025 - Fusion Media Limited. All Rights Reserved.