Selloff or Market Correction? Either Way, Here's What to Do NextSee Overvalued Stocks

GBP: Finds Fibonacci Support

Published 05/04/2015, 04:58 AM
Updated 05/14/2017, 06:45 AM
GBP/USD
-
DX
-

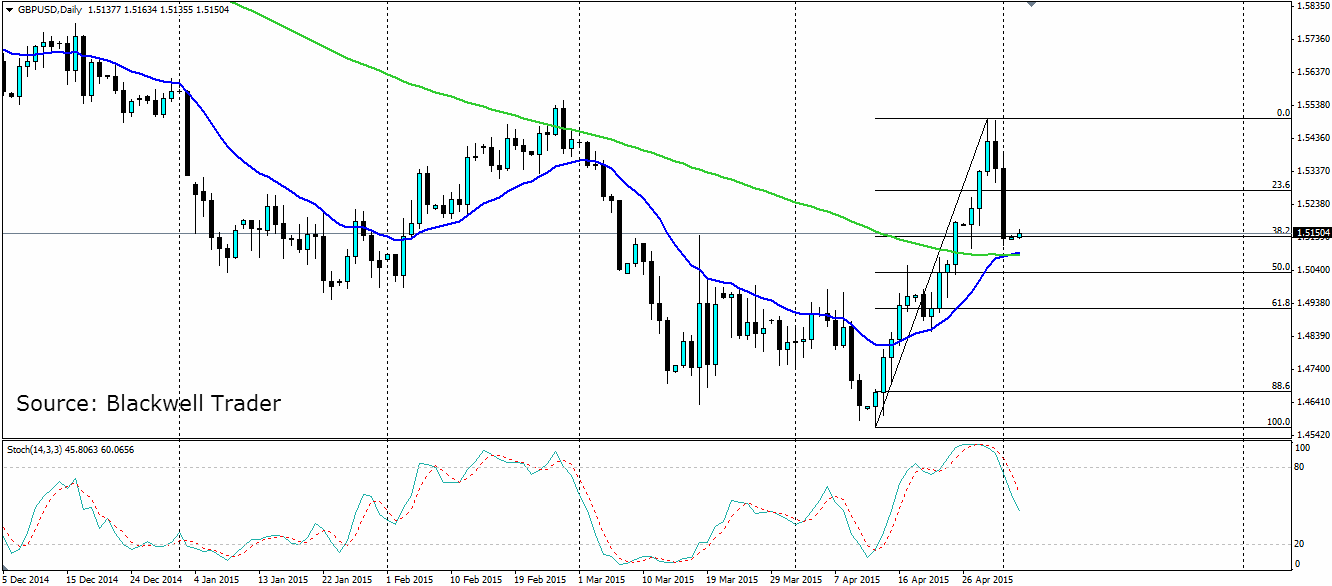
The pound saw a sharp correction at the end of last week which retraced back to the 38.2% Fibonacci line. If this gives way, the 50% line will prove tougher to break, as it has acted as a pivot point before.
GBP/USD Daily Chart

The market shrugged off the UK GDP figures which were a big miss early on in the week. Q1 2015 GDP came in at 0.3% q/q, down from 0.6% the previous quarter. US Dollar selling ensured the pound was still bid higher. The Cable came unstuck later on in the week as the Manufacturing PMI fell from 54.4 to 51.9 and the US dollar was seen as a good buy.

The Construction and Services PMIs are both due early this week and the market will be eagerly awaiting the result of the UK general election on the 7th May. Both Labour and the Conservatives are even on 34% each, which will likely lead to a hung parliament. The market will likely be volatile as each new poll is released leading into the election.

The chart shows just how large that sell off was as it erased all of the gains made in the first half of the week and retraced back to the 38.2% Fibonacci level. The Stochastic Oscillator shows the momentum certainly on the bearish side as it moves from oversold at pace. We could see a push down to the 50% Fib level as the market gains volatility ahead of the election, but watch for the 100 day MA in between. A cross of the 20 EMA over the 100 day SMA could provide a bit of bullish pressure as the market see an end to the long term bearish trend.
GBP/USD 4 Hourly Chart

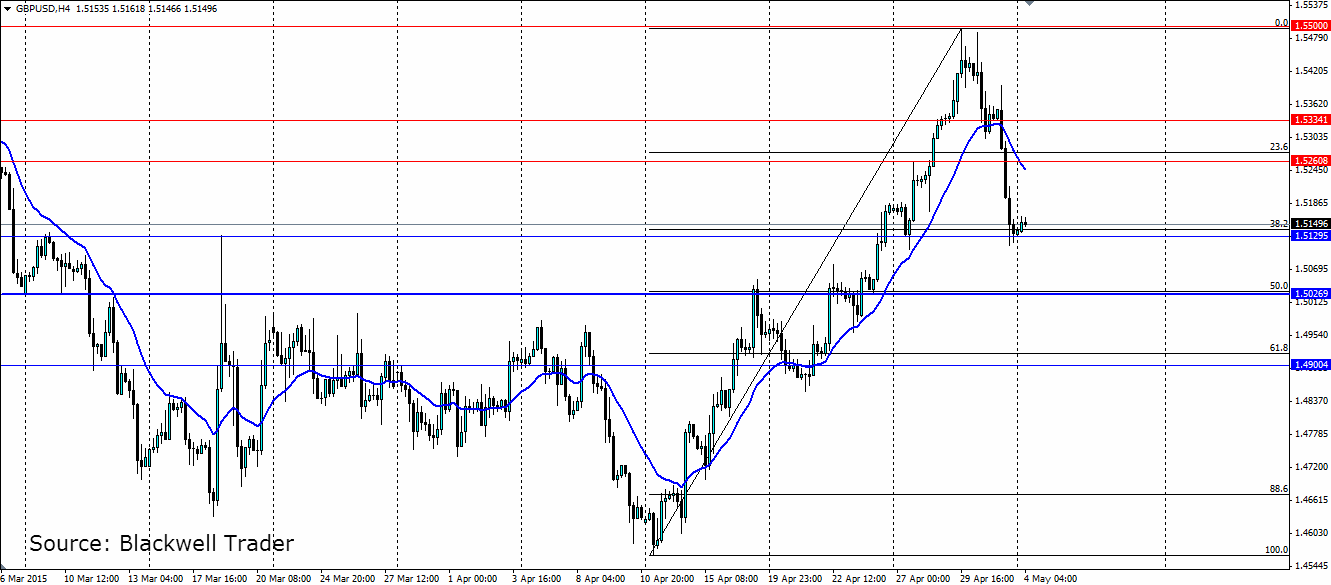
Resistance for the GBP/USD pair is found at 1.5260, 1.5334 and 1.5500. Support can be found near the current level at 1.5129, with further support at the 50% Fib level at 1.5026, and 1.4900. The 50% level looks like it will be a sticking point for the price and will make a good target for any short term shorts out there.

Latest comments

Loading next article…
Risk Disclosure: Trading in financial instruments and/or cryptocurrencies involves high risks including the risk of losing some, or all, of your investment amount, and may not be suitable for all investors. Prices of cryptocurrencies are extremely volatile and may be affected by external factors such as financial, regulatory or political events. Trading on margin increases the financial risks.
Before deciding to trade in financial instrument or cryptocurrencies you should be fully informed of the risks and costs associated with trading the financial markets, carefully consider your investment objectives, level of experience, and risk appetite, and seek professional advice where needed.
Fusion Media would like to remind you that the data contained in this website is not necessarily real-time nor accurate. The data and prices on the website are not necessarily provided by any market or exchange, but may be provided by market makers, and so prices may not be accurate and may differ from the actual price at any given market, meaning prices are indicative and not appropriate for trading purposes. Fusion Media and any provider of the data contained in this website will not accept liability for any loss or damage as a result of your trading, or your reliance on the information contained within this website.
It is prohibited to use, store, reproduce, display, modify, transmit or distribute the data contained in this website without the explicit prior written permission of Fusion Media and/or the data provider. All intellectual property rights are reserved by the providers and/or the exchange providing the data contained in this website.
Fusion Media may be compensated by the advertisers that appear on the website, based on your interaction with the advertisements or advertisers.
© 2007-2024 - Fusion Media Limited. All Rights Reserved.