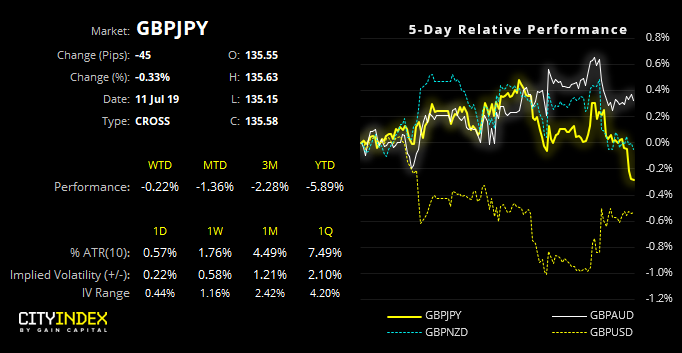
GBP weakness persists with it falling against all crosses apart from the USD. Here are the three setups we prefer from a reward to risk perspective.
Data was mixed for the U.K. yesterday. Industrial and manufacturing output missed expectations following their large drops in May. Whilst they did rebound to a degree, it’s a minor victory at best given it was fuelled by a delay in car plant closures. GDP great at 0.2% versus 0% expected, and the annual rate was upwardly revised to 1.5% YoY (from 1.3%). Construction output also slightly beat expectations. However, economists see little to get excited about in the numbers and see further weakness ahead for the U.K. economy.
Furthermore, dovish comments from BoE’s Tenreyro has weighed on Sterling, suggesting a rate cut would be more likely in event of a no deal Brexit and sees no pressure to vote for a U.K. rate hike any time soon. A dovish Powell yesterday may have been enough to lift GBP/USD from its lows yet has done little to lift Sterling against other peers. Whilst it remains in strong downtrends against all other majors, the following three appear the most appealing from a reward to risk perspective.
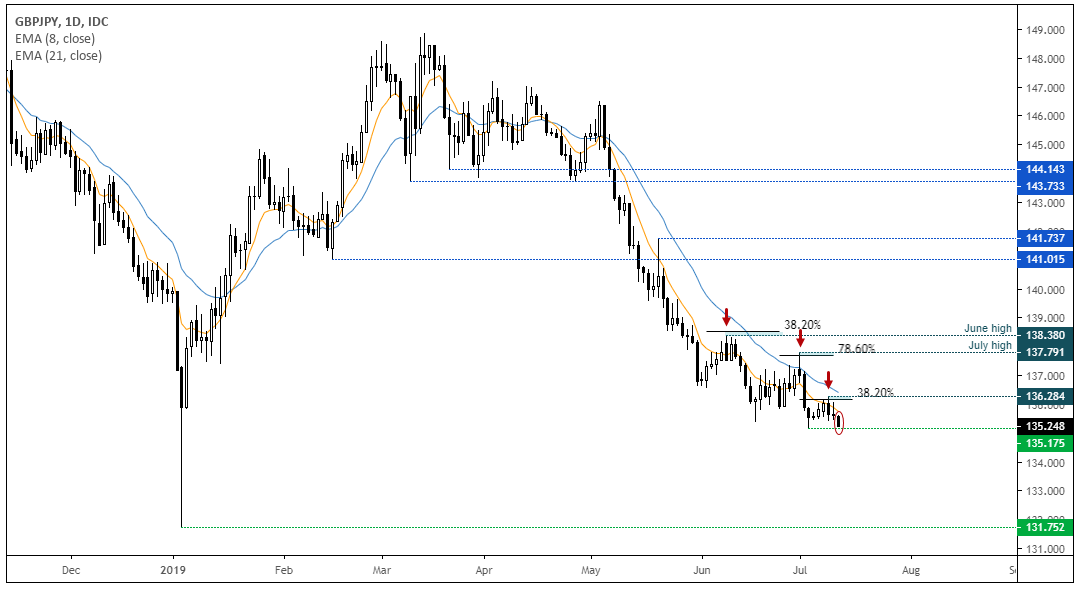
GBP/JPY is on the cusp of new lows and heading to its lowest level since January’s flash-crash and has produced two lower highs since our previous analysis. In fact, if we were to look past January’s low-liquidity spike, a break lower would take GBP/JPY to its lowest level since Trump was elected as president.
- Technically, GBP/JPY remains in a strong downtrend
- The prior three retracements have respected classic Fibonacci levels
- The 136.28 high produced a bearish outside candle to mark a potential swing high
- We remain bearish below 136.28 and a clear break beneath 135.16 assumes trend continuation
- We’d use an open target and keep an eye on price reactions near round numbers (134, 133)
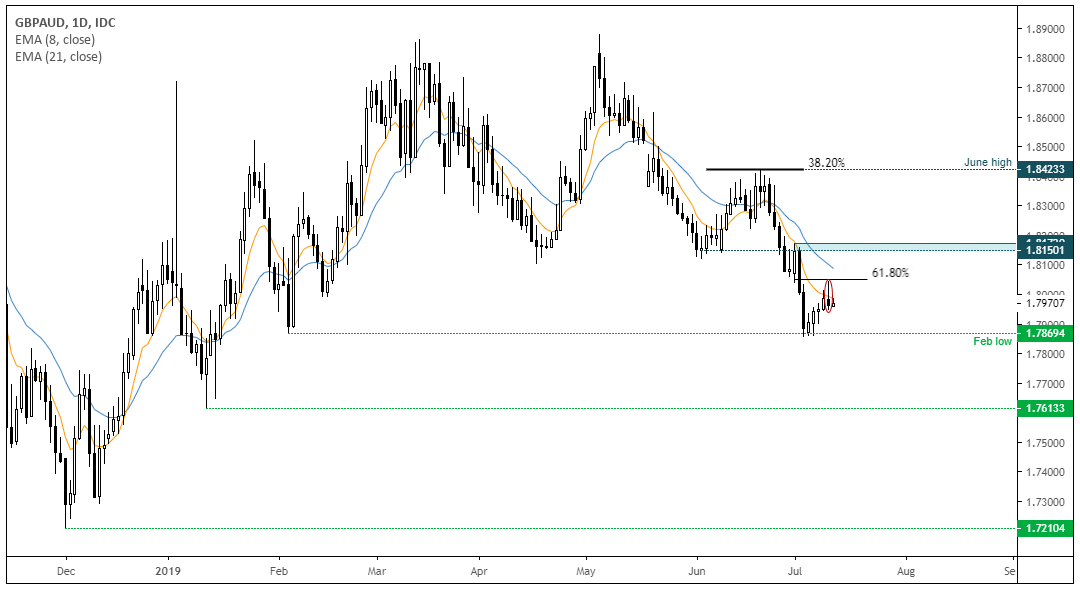
GBP/AUD could be setting itself up for a short swing trade. A larger bearish reversal appears to be playing out since its break beneath 1.8100, and momentum has remain bearish overall since stalling at 38.2% Fibonacci level after an underwhelming rebound. We’re now looking to identify a higher low.
- Prices have retraced from the Feb low, and stalled below the 61.8% Fibonacci level and between the 8 and 21-day eMA’s
- A bearish hammer has formed to show hesitancy to break higher. Although, take note that hammer’s do not always mark the actual swing high – but can warn of one
- Either look for a series of bearish reversal candles to form (to gain more confidence a level of resistance is being carved out) before considering fading into the move
- Alternatively, if bearish momentum returns, we can assume lower high is in
- Initial target is the Feb low but, given the strength of the bearish trend we expect this support level to break
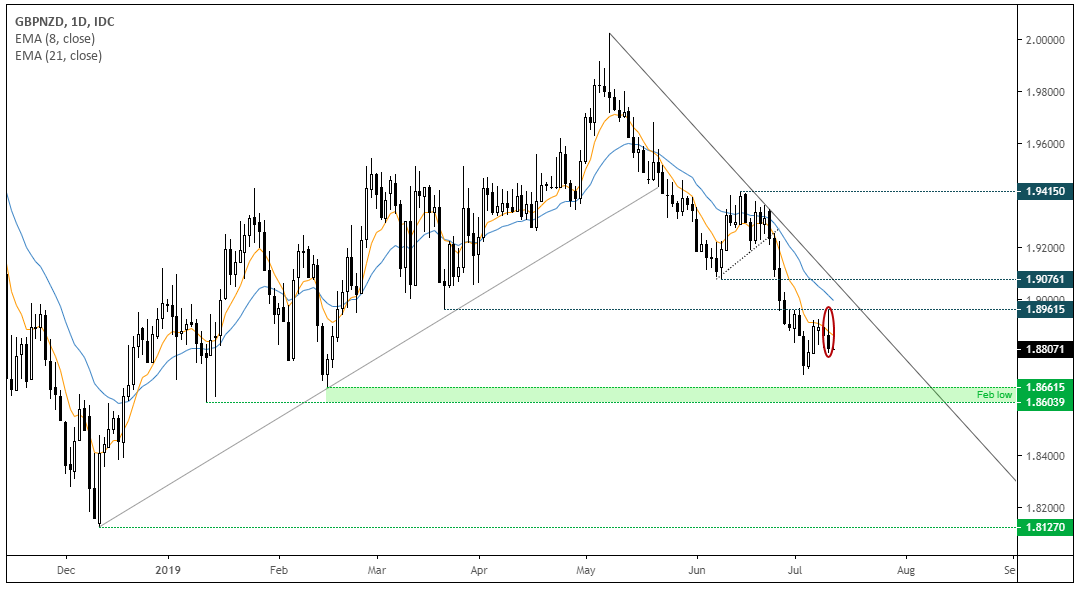
Bearish Engulfing candle on GBP/NZD suggests the high is in. Since breaking out of compression, GBP/NZD’s bearish trend has developed nicely and now brings the 1.8660 low back into focus.
- The bearish engulfing candle has formed around the 8-day eMA and reinforces resistance at 1.8962
- With the swing high likely in, we could consider entering a break beneath yesterday’s low
- Alternatively, fade into moves within yesterday’s range (engulfing candles can be useful for this and less prone to new highs before the actual sewing high occurs, unlike pinbars)
- Initial target is the Feb low but, given strength of the trend structure, we’re anticipating a break lower


