
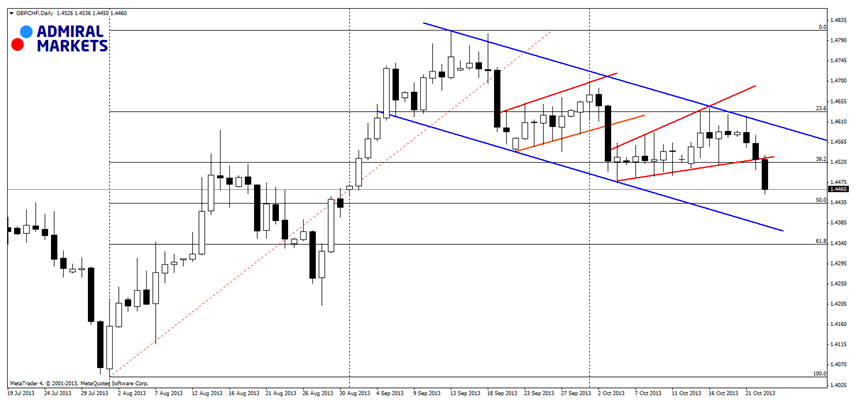
After few strong weeks, the GBP is looping its previous gain and falling into a correction movement. On the GBP/CHF, the correction is very technical and bears managed to form the channel down which also contains smaller wedges inside of it. The previous wedge resulted to a downswing, and as we see, today’s candle has all it takes to become a breakout candle, triggering a major sell signal on this pair. If this candle closes near the current levels, it will be the first candle to close below the 38.2 Fibonacci level which should have bearish implications. The closest supports should be at 50 and 61.8 Fibonacci, as well as lower line of the channel down formation. In the longer-term, blue lines may be viewed only as a flag and should indicate a willingness for a possible bullish breakout, leading to a mid-term tops. But as long as the price is between those lines, the main signal should be a sell signal.
 GBP/CHF Daily Chart" title="GBP/CHF Daily Chart" width="864" height="411">