Daily Forex Market Preview - March 3, 2016
The ADP payrolls numbers released yesterday showed a better than expected print, with private payrolls rising 214k above estimates. The US dollar remained well supported across the board and the markets are likely to move sideways ahead of tomorrow's nonfarm payrolls numbers.
British pound continues to recover after hitting 9-year lows last week, while the euro remains weak as ECB officials hinted at further rate cuts at the next meeting.
Meanwhile, gold continues to trade sideways and we could anticipate a possible breakout when the monthly jobs report from the US is released tomorrow.
EUR/USD Daily Analysis

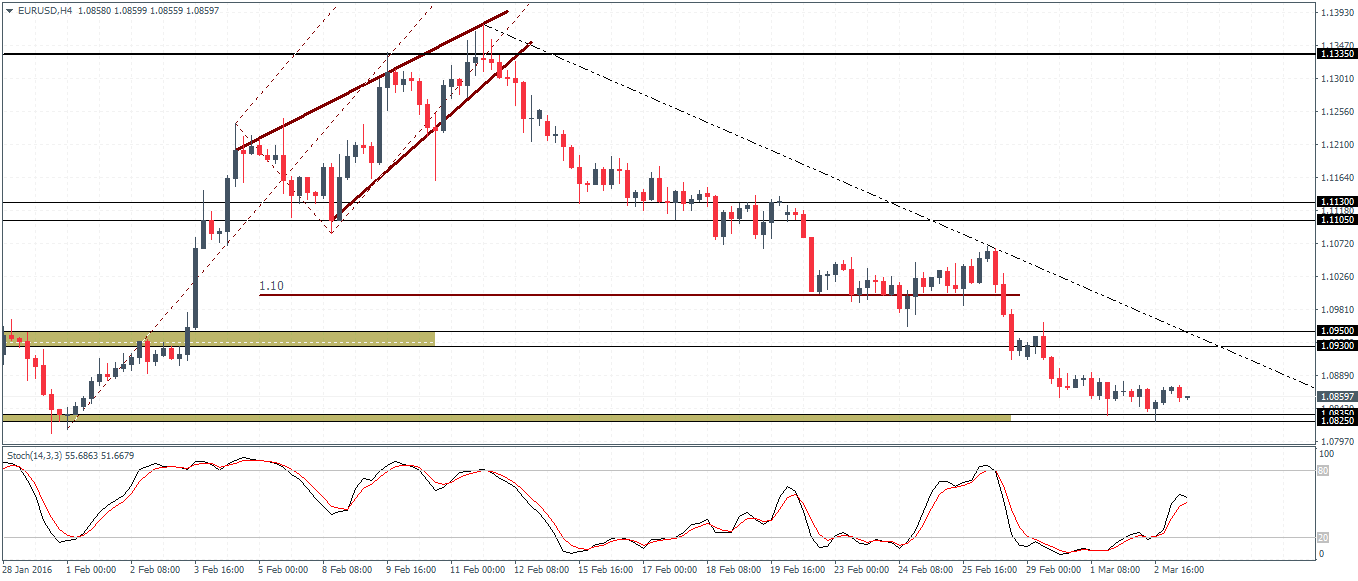
EUR/USD (1.08): EUR/USD formed a doji pattern yesterday following the previous day's small bodied candlestick pattern. Prices briefly touched the 1.0835 - 1.0825 support before pushing higher on price rejection. A firmer test of support here could see the support being tested ahead of further direction being established. With the trend line firmly established, a break below the support could see further declines lower as 1.056 comes into question. Alternately if the 1.0835 - 1.0825 support holds, EUR/USD could post a bounce to 1.10 handle. Overall, EUR/USD is likely to start trading sideways within the mentioned levels.
USD/JPY Daily Analysis

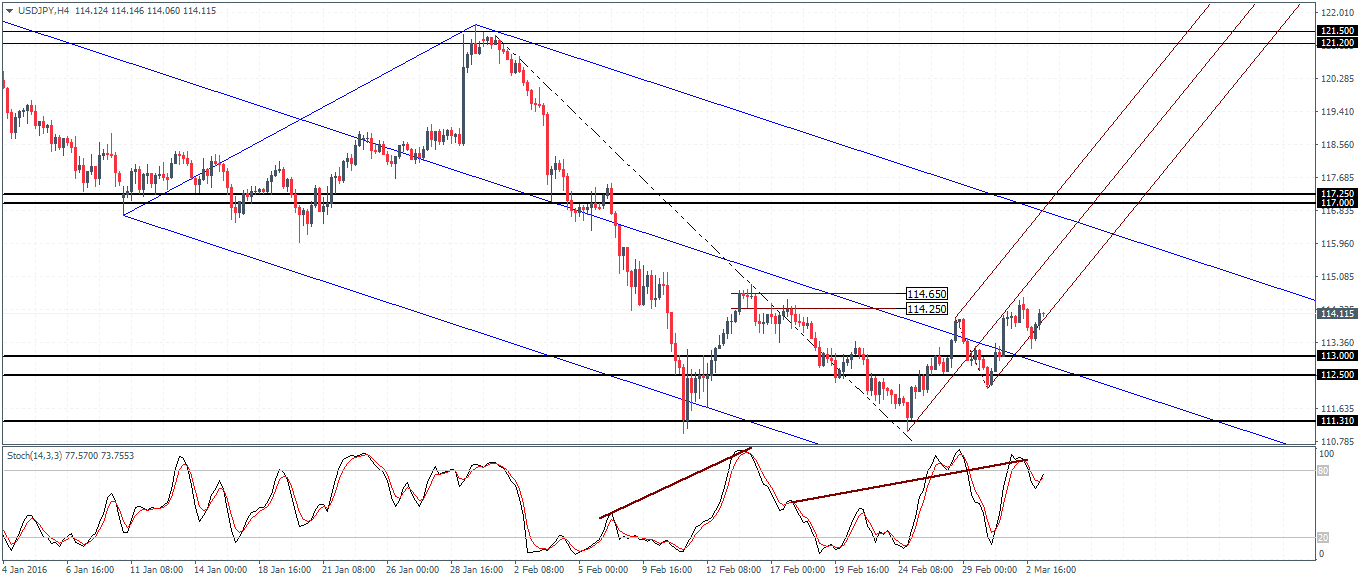
USD/JPY (114.1): USD/JPY closed on a bearish note yesterday, but today's price action has been bullish. Prices remain capped with the 20-day EMA to the upside while support at 112 is firmly established. The daily chart shows a hidden bearish divergence currently in place with the Stochastics forming a higher high on price's lower high, indicating a move lower to retest the 112 support. On the 4-hour chart, the lower median line looks to have held the declines with prices currently attempting to push higher. However, only a break above the previous high of 114.3 will confirm further upside gains, failing which, 113 - 112.5 support will be likely tested.
GBP/USD Daily Analysis

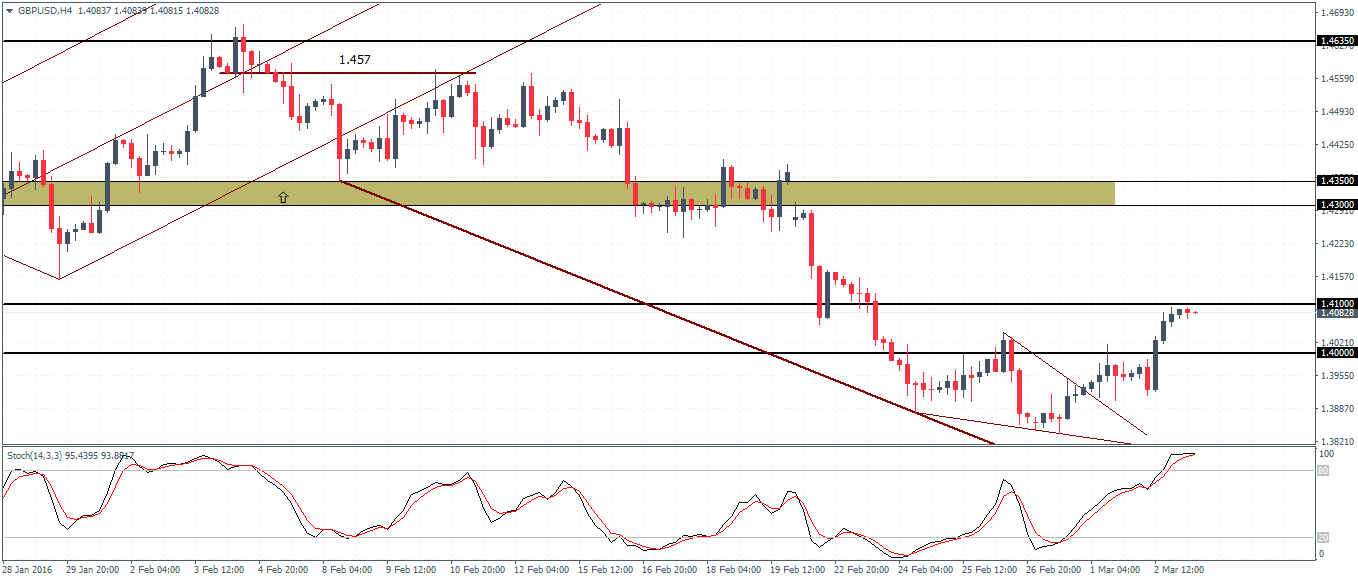
GBP/USD (1.40): GBP/USD has closed bullish for the third consecutive day following the dip to the lower median line from the daily chart. The Stochastics remain in oversold levels and it is likely for the upside momentum to continue towards 1.42 resistance. On the 4-hour chart, the descending triangle noted yesterday has seen a breakout to the upside. A dip to 1.40 could see further upside, with 1.41 coming in as the initial resistance ahead of a test to 1.42 and possibly to 1.43 where a pending retest of the resistance awaits. Prices remain poised in this correction mode unless we see a significant close below 1.40 which could send GBP/USD back to previous lows.
Gold Daily Analysis

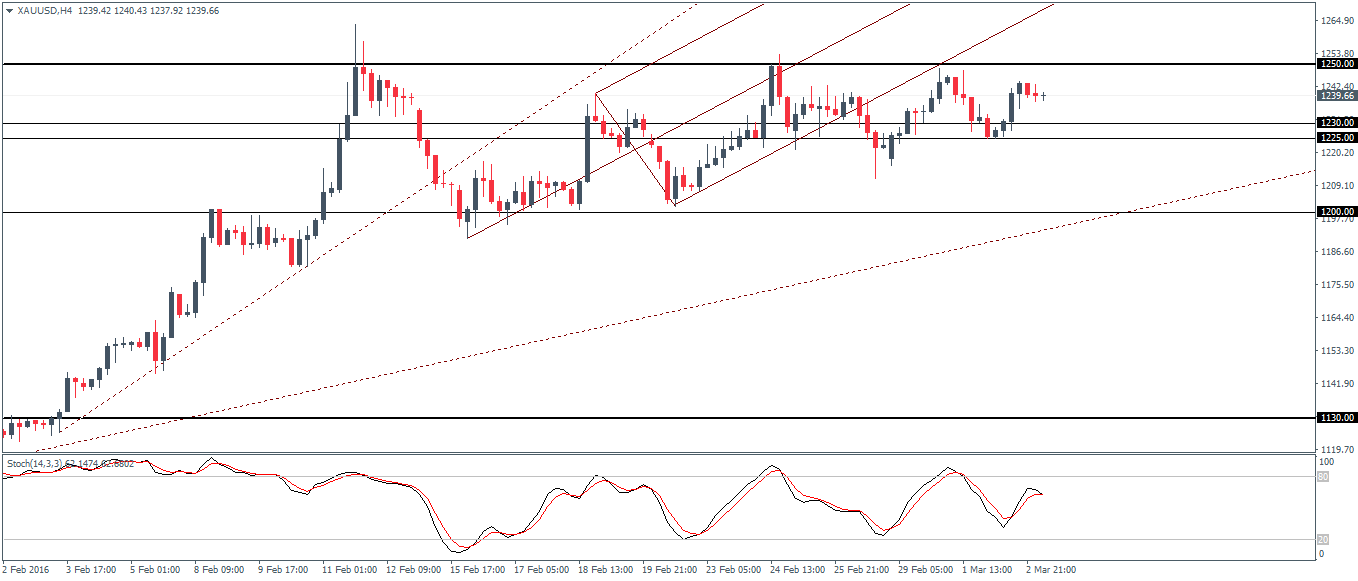
XAU/USD (1239): Gold prices continue to trade flat with yesterday's price action seeing a bullish close. With the 1250 resistance and 1230 - 1225 support holding out so far, gold remains range-bound. Above 1250, there is a potential for gold to test new highs, while to the downside, below 1225, gold could dip lower to the 1200 key psychological support level. With no clear candlestick patterns on the daily chart, the sideways range is likely to continue.
