A reoccurring pattern on GBP/AUD (similar to GBP/JPY too) may have provided clues to the next bullish peg

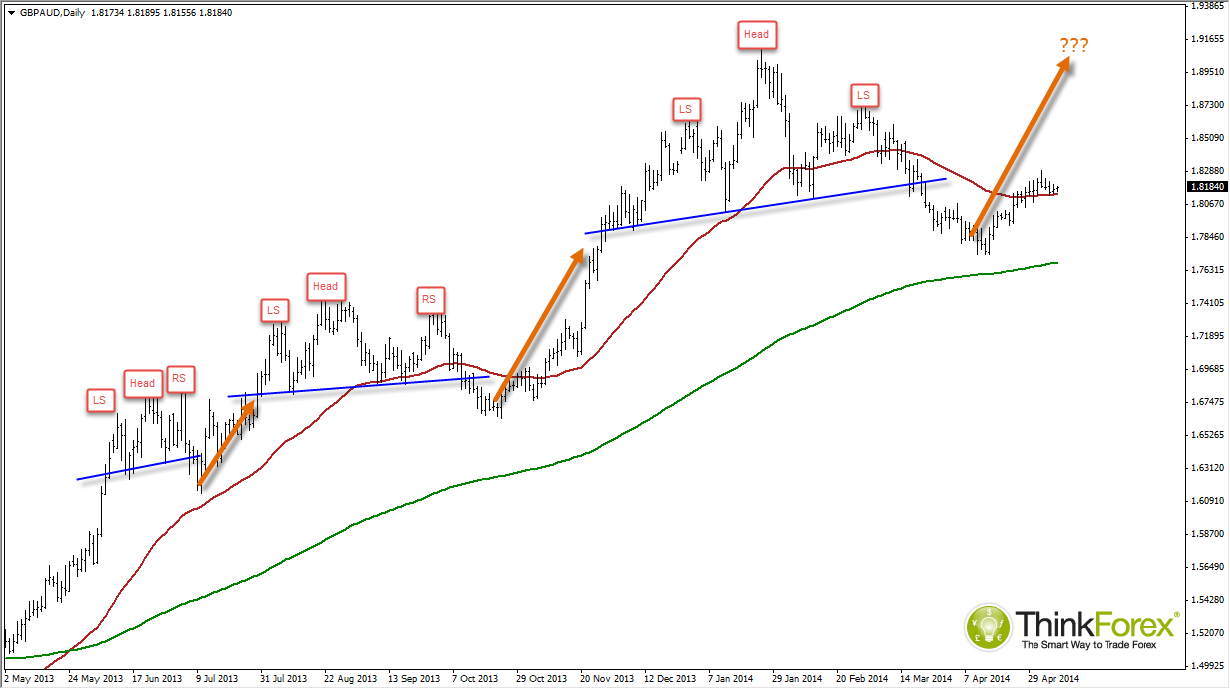
Between May-June 2013 there is a fairly volatile (and by no means prettty0 Head and Shoulders which failed to get anywhere near the usually target projected from the head to the breakout line. Instead we saw a minor break to the downside before a reversal and bullish continuation.
Then between July - September 2013 a larger H&S formed, but this time the oscillations were more timely. I remember this particular pattern unfolding as it was one I was following. When we saw the downside break I had noted that the break did not occur with any vengeance and lacked dedication to a bearish move. Again we saw the limited downside, failure to reach anywhere near the target before a bullish continuation and for GBPAUD to reach record highs.
Which bring me to the 3rd H&S between November '13 to March '14. The target (if reached) would be back near 1.76 but again the downside break of the neckline lacks the preferred bearish momentum and now trading at similar levels to the breakout line. I have pretty much written this off as a bearish pattern now but instead using the previous failures to assume a bullish continuation, as before, in line with the 50 and 200 eMA.
With any luck we shall soon witness increased bullish momentum and for it to trade above 1.910 highs. If you look at the recent run up from 1.77, the trajectory is similar to the one back on Oct '13, so whilst I do not provide a particular buy signal today, it is definitely a pair I am monitoring to try and jump on board a decent bullish run.

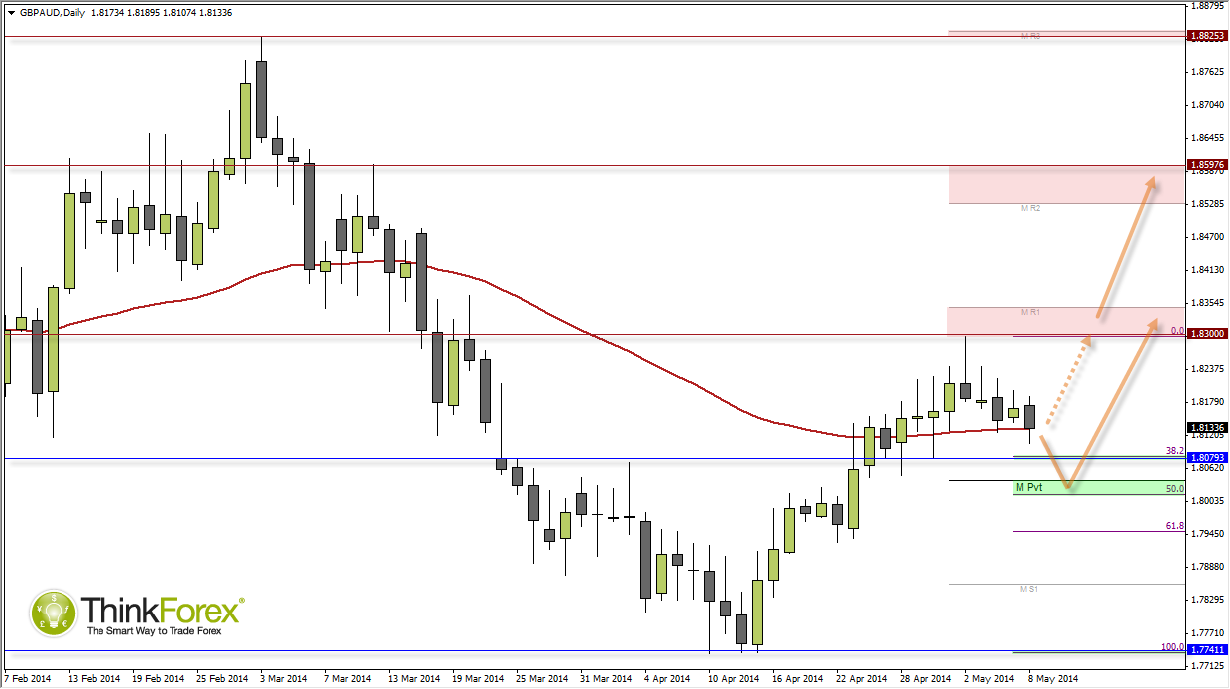
Price currently hovers above 38.2% and 1.808 horizontal support; however as a confluence zone I prefer the Monthly Pivot and 50% around the round number 1.80. I will consider any buy signals above this area to hop on board the anticipated bullish trend.
