Around my part of the world it is Mobil at the pumps. But I grew up with my mother working for Exxon. She was a computer programmer modeling sludge movement for the engineers. Bad ass. So I am comfortable with both brands and the combination of name despite the signage.
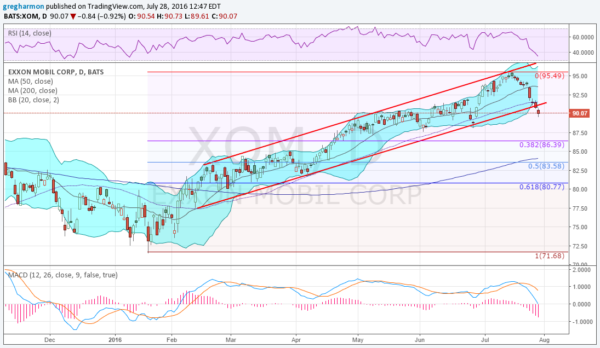
The stock went through a long downturn with falling oil prices but found a bottom in January. Since then it has moved higher is a rising channel. After a 30% move higher in just under 5 months it broke that channel to the down side Wednesday and is following through today.
The 200 day SMA stands below at about $84. The stock has not been in contact with that since the Golden Cross printed February 24th. Momentum indicators support more downside in the stock.
The RSI has fallen below 40, moving into the bearish zone. It is also making a new 6 month low. The MACD crossed down in the middle of the month and is about to turn negative. The Bollinger Bands® are also opening to the downside.
There is a case for support below at the prior lows from 87.50 to 88 and then at 85 before 82. A 38.2% retracement of the move higher would mean a pullback to 86.39. On a reversal higher there may be resistance at 92 and 93.75 before 95.50. Short interest is just over 1% in this stock, so not a factor.
The weekly options chain shows that traders expect the stock to move $1.75 by Friday's close. That 1.94% move is slightly less than the 2.13% move it has seem following the last 6 reports.
The open interest is biggest on the put side at the 89 and 90 strikes with smaller pockets at 87.5 and from 91 to 92.5. On the call side the biggest open interest stands at 95 with some size at 97.5.
ExxonMobil (NYSE:XOM)

Trade Idea 1: For the long holder, protection can be had by buying a weekly 90 Put for about $0.90. This gives protection as far down as the stock might go. If comfortable that the options traders have the move measured correctly at $1.75 then you can also sell the weekly 88 Put for about 25 cents to cut your cost by 25%.
With the large open interest at the 89 Strike you might consider selling that for a tighter spread and another 25% reduction. Then selling an August 92.5 Covered Call for 40 cents brings your down even further. Full Collar: Long July 29 Expiry 90/89 Put Spread and selling August 92.5 Call for free.
Trade Idea 2: For the speculator the path of least resistance looks lower. A Put or Put Spread of some sort looks appropriate. Buying a 1×2 Put Spread or a Put Butterfly can give a range to the downside very cheaply.
The weekly 90/89 1×2 Put Spread, buying the 90 Put and selling 2 of the 89 Put, gives downside participation until 89 and then still makes money until 88. this trade pays a 5 cent credit. It also expose you to owning the stock with a basis of 88. if you do not want to own it then also buy a 88 Put to make a Put Butterfly. Put Butterfly: Buy the July 29 Expiry 90/89/88 Put Butterfly for 22 cents.
Trade Idea 3: If you wish to own this stock, but from a lower level, then a 1×2 Put Spread or a a Put Diagonal fits your view. The 1×2 Put Spread is discussed above. For a Put Diagonal we look out the August expiry and see very large open interest at the 85 strike.
Remember this is very near the 200 day SMA. Buying the weekly Puts and selling the August puts creates the Diagonal. Combining these two gives short term downside participation and then a possible entry in August. July 29 Expiry 90/July 29 Expiry 89-August 85 1×2 Split Put Spread for 6 cents.
DISCLAIMER: The information in this blog post represents my own opinions and does not contain a recommendation for any particular security or investment. I or my affiliates may hold positions or other interests in securities mentioned in the Blog, please see my Disclaimer page for my full disclaimer.
