There are enough analysts believing the USA is in, or about to be in, a recession – that one is kept in a higher alert status for signs. These informed opinions need to be taken seriously as the economy remains so weakly expanding that only small movements in growth could produce the criteria of a recession.
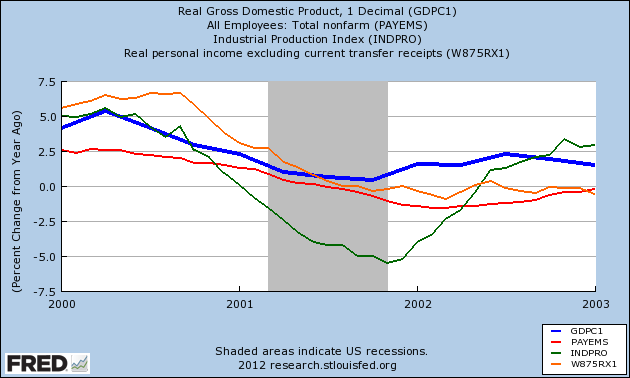
And recession determinations are not as straight forward as most believe. I keep tripping back to the “strange” recession of 2001 where the BEA completely revised away negative GDP, and the start date of this recession (peak economic activity – if one uses some of the indicators the NBER normally uses to firmly affix the start date) – is in 1Q2000 (instead of 1Q2001).
No matter how much pundits spout (or the NBER rambles on their website) about the quantitative aspects of determining recessions, in the final analysis – it is simply an opinion based on moving data points.
I will not be badmouthing those who, based on their “opinion,” have welcomed you to the Recession of 2012 even though I do not believe we are in a recession using current definitions. More importantly non-monetary real time measures (except container counts) are not recessing yet.
The past week several pundits have pointed to falling gasoline consumption as an indicator of a recession. Fuel consumption intuitively SHOULD be an important and real economic indicator as modern economies are based on energy. But alas, I have been frustrated in the past trying to correlate fuel consumption to the economy – and the Ceridian-UCLA Pulse of Commerce Index crashed and burned trying to correlate diesel to the economy.
The mistake we continue to make is believing the post Great Recession economy is similar to the economy of the 20th century. Fuel usage historically correlated well to economic activity – but no more.
To demonstrate the randomness of using gasoline consumption as an economic metric, look at the year-over-year data comparing miles driven versus gasoline consumed. There is just not a good correlation between car usage and gasoline sales. 
The economy cannot be defined by a single metric – and thus fuel consumption is distorted by improving fuel consumption statistics, elasticity in demand due to price, and continuing new normal changes in consumer behavior.
Other Economic News this Week:
The Econintersect economic forecast for September 2012 shows moderate growth continuing. Overall, trend lines seem to be stable even with the fireworks in Europe, and poor data from China. There is a whiff of recession in the hard data – excluding certain surveys are at recession levels – with container imports contracting for two months in a row.
ECRI is still insisting a recession is here (a 07Sep2012 post on their website). ECRI first stated in September 2011 a recession was coming . The size and depth is unknown. The ECRI WLI growth index value improved this week enjoying its fourth week in positive territory. The index is indicating the economy six month from today will be slightly better than it is today.
Current ECRI WLI Growth Index
Initial unemployment claims were unchanged – from 382,000 (reported last week) to 382,000 this week. Historically, claims exceeding 400,000 per week usually occur when employment gains are less than the workforce growth, resulting in an increasing unemployment rate (background here and here). The real gauge – the 4 week moving average – rose slightly from 375,000 (reported last week) to 377,750. Because of the noise (week-to-week movements from abnormal events AND the backward revisions to previous weeks releases), the 4-week average remains the reliable gauge.
Weekly Initial Unemployment Claims – 4 Week Average – Seasonally Adjusted – 2010 (blue line), 2011 (red line), 2012 (green line) 
Data released this week which contained economically intuitive components(forward looking) were
- Rail movements (where the economic intuitive components continue to be indicating a moderately expanding economy).
- The import portion of container counts has contracted now two months in a row. One should never rely on a single pulse point, but imports correlate to economic expansions and contractions.
Weekly Economic Release Scorecard:
Click here to view the scorecard table below with active hyperlinks.

Bankruptcies this Week: Imaging3, Global Aviation Holdings, Pet Ecology
