
Gap Inc. (NYSE:GPS) just released its first quarter fiscal 2017 financial results, posting earnings of 36 cents per share and revenues of $3.4 billion. Currently, GPS is a #3 (Hold) on the Zacks Rank, and is up 3.49% to $24.00 per share in trading shortly after its earnings report was released.
Gap:
Beat earnings estimates. The company reported diluted earnings of 36 cents per share, surpassing the Zacks Consensus Estimate of 29 cents per share.
Matched revenue estimates. The company saw revenue estimates of $3.4 billion, coming in-line with our consensus estimate of $3.41 billion and were flat compared to the first quarter of 2016.
For Q1, total comparable sales were up 2% versus a 5% decrease last year. Breaking it down by brand, Old Navy saw positive comps of 8%, Gap saw negative comps of 4%, and Banana Republic saw negative comps of 4%, though BR has improved drastically year-over-year. In the prior year period, BR reported comps of negative 11%.
Gap reaffirmed its full-year diluted earnings per share guidance to be in the range of $1.95 to $2.05, and the company continues to expect comps to be flat to up slightly. Gap anticipates net sales for fiscal 2017 to be slightly below this range, driven by an expected negative impact from foreign currency fluctuations year-over-year.
“We are pleased with our positive comp and earnings growth this quarter,” said Art Peck, president and chief executive officer, Gap Inc. “We've made substantial improvements in product quality and fit, and our increasing responsive capabilities are enabling us to better react to trends and demand."
"While the retail environment continues to be challenging, we are focused on delivering the best possible product and customer experience, and our ability to leverage a portfolio of iconic brands and operating scale uniquely positions the company for long-term growth,” Peck continued.
Here’s a graph that looks at Gap’s price, consensus, and EPS surprise:
Gap, Inc. (The) Price, Consensus and EPS Surprise
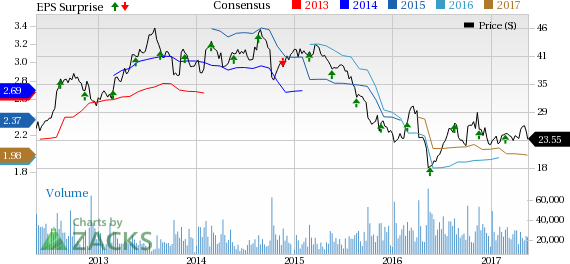
Gap, Inc. (The) Price, Consensus and EPS Surprise | Gap, Inc. (The) Quote
The Gap, Inc. is a global specialty retailer which operates stores selling casual apparel, personal care and other accessories for men, women and children under the Gap, Banana Republic and Old Navy brands. The company designs virtually all of its products, which in turn are manufactured by independent sources, and sells them under its brand names.
Stocks that Aren't in the News…Yet
You are invited to download the full, up-to-the-minute list of 220 Zacks Rank #1 "Strong Buys" free of charge. Many of these companies are almost unheard of by the general public and just starting to get noticed by Wall Street.
They have been pinpointed by the Zacks system that nearly tripled the market from 1988 through 2015, with a stellar average gain of +26% per year. See these high-potential stocks now>>
Gap, Inc. (The) (GPS): Free Stock Analysis Report
Original post
Zacks Investment Research