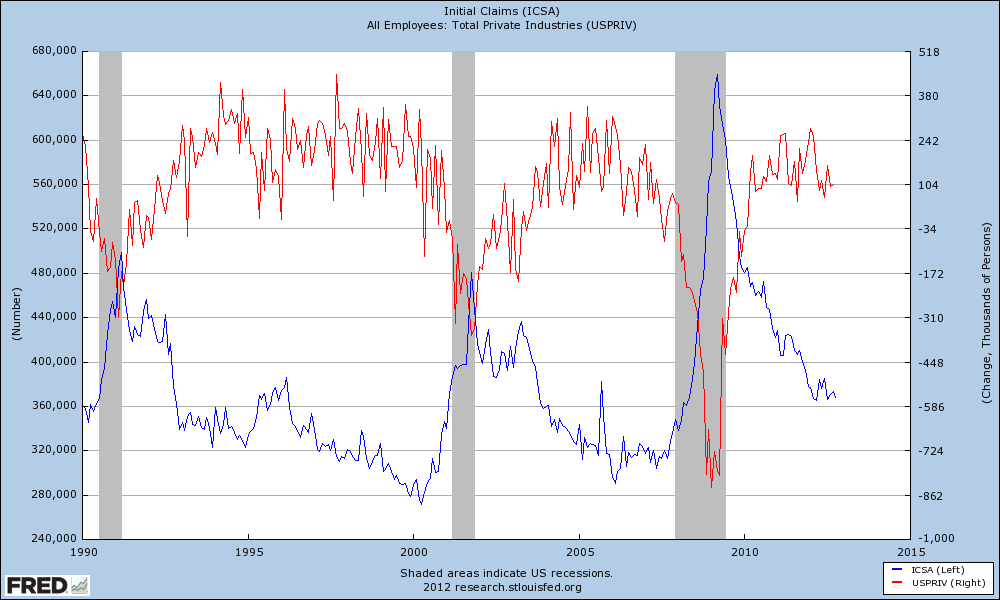
Most believe there is something wrong with jobs growth – and the current jobs growth is anemic compared to the past. While it is true that jobs growth is not good currently, it is not much worse than most of the growth in the 21st century.
- The monthly non-farm private payroll data is very noisy so it is difficult to get a clear perspective of growth;
- The highest twelve month rolling average in the 21st century of monthly non-farm private jobs gains was in early 2006 when the employment gains averaged 225,000 per month.
- The highest twelve month rolling average in the 1990′s of monthly non-farm private jobs gains was in early 1995 when the employment gains averaged 305,000 per month.
- The highest twelve month rolling average since the Great Recession of monthly non-farm private jobs gains was in January 2012 when the employment gains averaged 189,000 per month. Currently the average is 155,000.

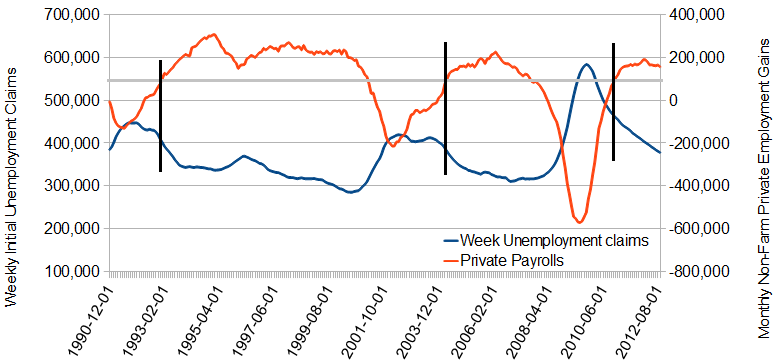
Even though the data in the above graph is seasonally adjusted, the variation from month-to-month (noise) is significant. The data in the above graph has been replotted removing the noise by using a twelve month rolling average.

The grey line added is at 100,000 per month non-farm private jobs growth. Please note that except for the Great Recession recovery – jobs growth started returning to normal once weekly initial unemployment claims fell below 400,000 per week. The Great Recession employment recovery started when initial weekly unemployment claims fell to only 460,000.
My opinion and observations of using of weekly initial unemployment claims to forecast employment:
- the average weekly claims in recent history seldom falls below 300,000;
- once employment growth stabilizes following a recession, weekly initial unemployment claims are not that intuitive of employment growth;
- the current jobs growth is approximately at the levels seen during the better economic times of the 21st century – regardless of the ups and downs in the weekly initial unemployment claims.
There are all sorts of rhymes about history repeating, but it is clear that the historical relationship between initial claims and employment gains was different in the Great Recession recovery. Even ignoring the difference, at this point in the economic cycle historically:
- both initial claims and the monthly employment gains can fall at the same time.
- both initial claims and the monthly employment gains can rise at the same time.
- initial claims and the monthly employment gains can move in opposite directions.
Other Economic News this Week:
The Econintersect economic forecast for October 2012 showed growth, but there was a serious degradation of the elements in the forecast. Overall, trend lines were broken to the downside. There is a diminishing whiff of recession in the hard data (plus a diminishing number of surveys are at recession levels), with container imports expanding for the first month in the last three.
ECRI is still insisting a recession is here (a 07Sep2012 post on their website). ECRI first stated in September 2011 a recession was coming . The size and depth is unknown. The ECRI WLI growth index value is enjoying its ninth week in positive territory. The index is indicating the economy six month from today will be slightly better than it is today.

Initial unemployment claims fell slightly – from 388,000 (reported last week) to 369,000 this week. Historically, claims exceeding 400,000 per week usually occur when employment gains are less than the workforce growth, resulting in an increasing unemployment rate (background here and here). The real gauge – the 4 week moving average – rose insignificantly from 365,500 (reported last week) to 368,000. Because of the noise (week-to-week movements from abnormal events AND the backward revisions to previous weeks releases), the 4-week average remains the reliable gauge.
Weekly Initial Unemployment Claims – 4 Week Average – Seasonally Adjusted – 2010 (blue line), 2011 (red line), 2012 (green line)

Data released this week which contained economically intuitive components(forward looking) were:
- Rail movements (where the economic intuitive components indicate a moderatelyslightly expanding economy).
- The trend lines of the CFNAI index do have intuitive elements, but the elements are mixed even though the index improved in September.
Click here to view the scorecard table below with active hyperlinks.

Bankruptcies this Week: Privately-held HMX
