The Math of Investing –
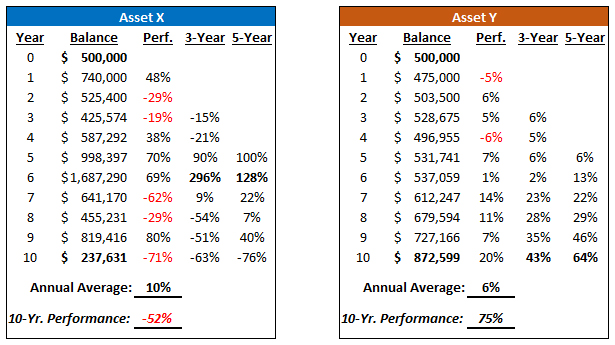
If you were asked to choose between two investments – Asset X, which has an average annual performance of 10% over the past 10 years, or Asset Y, which has an average annual performance of 6% over the past 10 years – which would you choose? It’s a “no-brainer,” right?
What if I also told you that within the last decade, Asset X experienced 3- and 5-year periods of phenomenal gains that included 296% and 128% respectively? Asset Y, on the other hand, topped out at 43% and 64% in its premier 3- and 5-year time frames. Pretty clear evidence that Asset X is superior, isn’t it?
It might surprise you to learn that, despite the amazing percentage gains for Asset X, a $500,000 initial investment in this fund dropped to $237,631 over the course of a decade. That’s correct… a 10% average annual return over a 10-year period resulted in a whopping 52% decline. You’ve lost more than HALF of your money!
Now let’s return to Asset Y – the fund that you didn’t think was worthy of your portfolio. The initial investment in Asset Y witnessed $500,000 grow to $872,599… a 75% increase during the same 10-year period. You nearly DOUBLED your money with a 6% average annual return.
Oh… it gets even better. Asset Y is sitting comfortably near all-time highs due to slow-and-steady progress. Yet Asset X is now 86% off of its record high. By choosing the flashier fund with the so-called better performance, one now requires roughly 614% to get back to an all-time peak.
Welcome to the wonderful world of investment math. (Please see below.)
This is no parlor trick; rather, it’s an exercise that demonstrates how performance numbers can be misunderstood. It’s a classic case of how perception can be confused with logic (e.g. a “no-brainer”), where we can easily be persuaded to make hasty, uninformed decisions.
Seeking out historical performance to discriminate between good and bad investment choices is commonplace advice. You’ll find this sort of “no-brainer” guidance in most of the books and articles written to help the individual investor. Well, an investment that averages a particular percentage should no longer pass your “Sniff Test.” It’s not enough to just ask questions and get answers. You need to ask the right questions; you need to understand dollar growth over time, not get sucked into clever fund marketing. You need to sidestep emotional pitfalls, including those that tap into excessive greed.
Professionals in financial services industries are well-trained in appealing to human emotions like greed and fear. They understand the art of persuasion; the sales tactics used are time-tested winners. After all, it wasn’t an anomaly that mortgage-related investment products and real estate within self-directed IRAs spread like a plague from 2005 to 2007. It’s also no accident that “guaranteed” annuity product sales soared following 2008-2009. Both instances represent classic examples of hype that drives a herd of lambs to slaughter.
Without even realizing it, many investors may be relying on the wrong information and misguided emotional instinct when making investment decisions.
Bear Market Math:
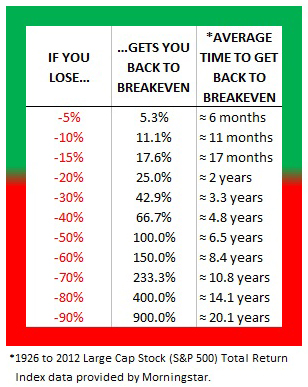
Bear market math is the term we use to describe a painful mathematic reality; that is, the more money you lose, the time (and magnitude of the return) needed to recover increases exponentially. But before we get into how bear market math can affect a portfolio, let’s first break down the formula for building wealth.
There are three basic components for securing your financial well-being: money (savings), growth (return), and time (years). It is impossible to build and maintain a nest egg for your long-term goals without each one of these items. Unless you are planning on a financial windfall, all three components are necessary.
However, not all three of these ingredients can be controlled. Money (what we earn and save) is one component where we have some measure of control. Education achievements, career paths, self-motivation, work ethic, budgeting, tax strategies, etc. – all have an effect on what we make and what we keep.
Growth, or the return on our money, is also controllable. Commodities, real estate, stocks, bonds, partnerships, trusts – there are literally tens of thousands of choices for investing our money. We even have choice with regard to how we access market-based securities, including individual issues, mutual funds, closed-end funds and ETFs. The size and accessibility of the investment menu alone assures us that there are opportunities to control portfolio outcomes. Whether we take advantage of those opportunities… that is a different issue altogether.
Time is what we are left with; time is constant and it is definitely out of our control. We cannot get back time. And yet, investors regularly squander this precious resource. The following is just a short list of things people tell themselves as they are squandering time and money:
1. “This stock has treated me so well in the past.”
2. “It can’t possibly go any lower from here.”
3. “I’m just going to hang on until it gets back to break-even.”
By utilizing a sell discipline, you can keep portfolio losses small and minimize the bulk of bear markets. You will spend less time getting back to a break-even point and more time growing your money during a recovery.
Disclosure: Gary Gordon, MS, CFP is the president of Pacific Park Financial, Inc., a Registered Investment Adviser with the SEC. Gary Gordon, Pacific Park Financial, Inc, and/or its clients may hold positions in the ETFs, mutual funds, and/or any investment asset mentioned above. The commentary does not constitute individualized investment advice. The opinions offered herein are not personalized recommendations to buy, sell or hold securities. At times, issuers of exchange-traded products compensate Pacific Park Financial, Inc. or its subsidiaries for advertising at the ETF Expert web site. ETF Expert content is created independently of any advertising relationships.
