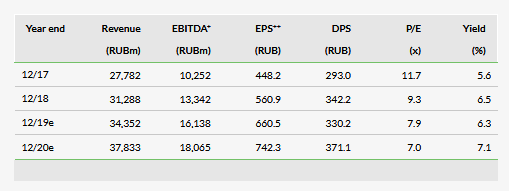
We have raised our FY19 and FY20 revenue forecasts by 3% and net income c 20%, following strong FY18 results that were above our expectations. We expect TransContainer to continue achieving sustained volume growth, benefiting from the structural trend towards growing containerisation and economic growth in Russia. We have increased our DCF-based valuation by 13% to RUB6,100/share.
Forecasts raised on the back of strong FY18 results
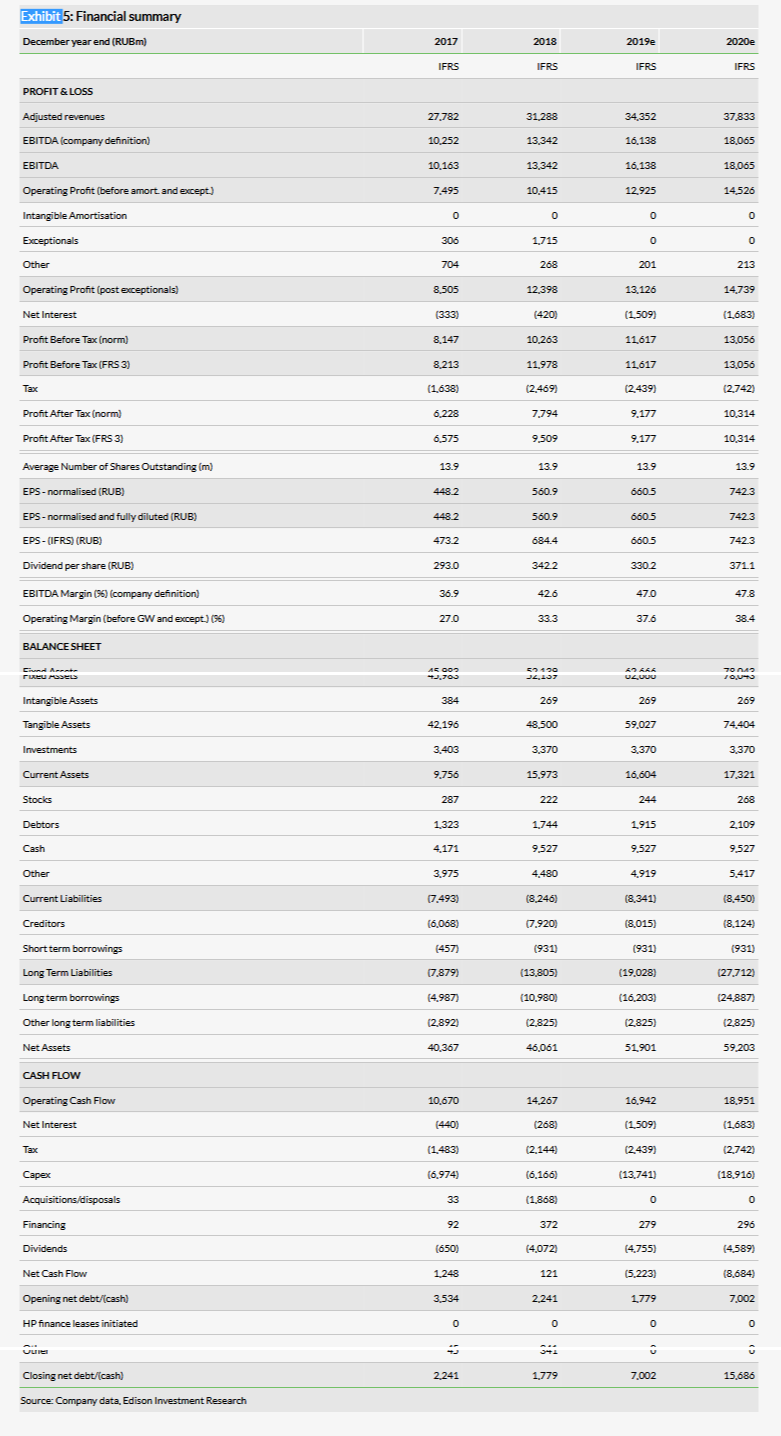
TransContainer posted strong growth in FY18, with adjusted revenues and net income respectively 3% and 15% higher than our forecasts. Results were better than our expectations, even though we recently upgraded net income by 26% following strong Q3 results. Adjusted revenues were up 12.6% to RUB31.3bn boosted by an increased share of higher value-added Integrated Freight Forwarding and Logistics Services. Operating profit grew 49% y-o-y to RUB11,559m, reflecting the strong revenue growth and expanding profit margins. We have raised our forecasts for FY19 and FY20, with revenues up 3% and net income up c 20%. We also expect net debt significantly lower than before, mainly due to lower-than-expected capex in FY18.
GDP growth and containerisation supports growth
Containerisation is a structural trend for the Russian market, and should support revenue and profit growth for TransContainer, in our view. Currently, only 7.2% of Russia’s potentially containerisable rail cargo is transported in containers and, although this figure rose from 2.2% in 2001, it is still much lower than in the US (18%), India (16%) and Europe (14%). GDP growth forecasts for Russia remain supportive with the World Bank estimating +1.5% for 2019 and +1.8% for 2020.
Valuation raised to RUB6,100/share
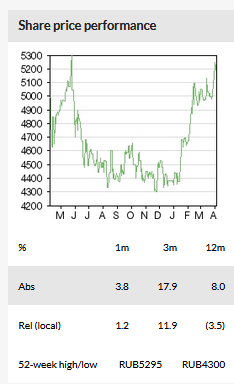
Even following the recent pick-up in the share price, we see room for further upside. We have raised our DCF-based valuation to RUB6,100/share (from RUB5,400) on the back of higher earnings estimates and lower than expected FY18 net debt. The stock is trading at a large discount to international transportation companies on P/E and EV/EBITDA multiples, respectively, which however may be at least partly explained by the limited liquidity of the stock and the higher country risk premium.
Business description
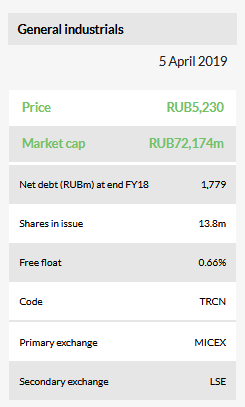
TransContainer owns and operates rail freight assets across Russia. Its assets comprise rail flatcars, handling terminals and trucks, through which it provides integrated end-to-end freight forwarding services to its customers.
FY18 results beat our expectations, forecasts raised
We raise our forecasts (FY19 and FY20 adjusted revenues up 3%, net income up c 20%) following FY18 results that were above our expectations. Our DCF-based valuation increases to RUB6,100/share (from RUB5,400/share) and we highlight that the stock trades at a large discount to international peers.
FY18 results above our forecasts
TransContainer posted strong growth in FY18, with adjusted revenues and net income respectively 3% and 15% higher than our forecasts. Results were better than our expectations even though we recently raised net income by 26% following strong Q3 results (see Growth accelerating in Q3, forecasts raised, published on 6 December 2018).
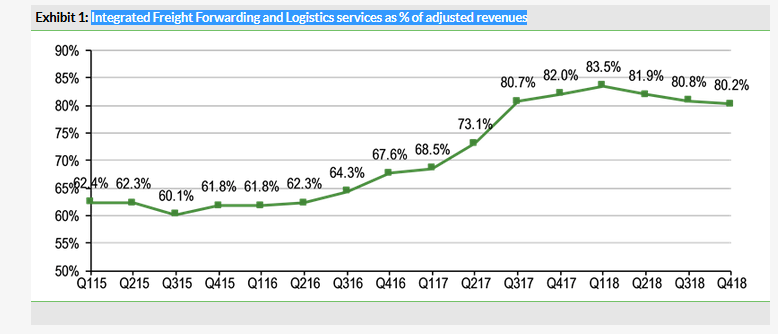
Adjusted revenues were up 12.6% to RUB31,288m, boosted by an increased share of higher value-added Integrated Freight Forwarding and Logistics Services, which represented 81.5% of FY18 revenues (vs FY17: 76.5%; FY16: 64.2%). However, we note that the transition to integrated services has softened in the most recent quarters (Exhibit 1).
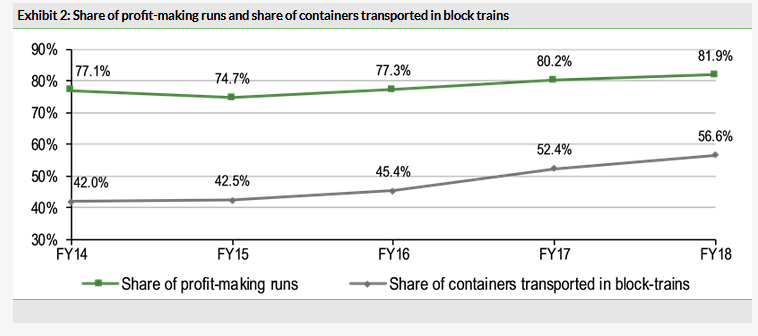
Operating profit grew 49% y-o-y to RUB11,559m, reflecting the strong revenue growth as well as expanding profit margins. We calculate that FY18 operating profit margin increased to 36.9% from 28.0% in FY17. We believe this expansion was driven by economies of scale (an overall increase in transportation volumes of 6.1% y-o-y), a shift to higher-margin integrated services activities (representing 81.5% of group revenues from 76.5%) and efficiencies, including an increase in the share of 'profit-making' runs (81.9% in FY18 vs 80.2% in FY17), as well as a higher proportion of containers transported in block trains, for which TransContainer receives a discount from Russian Railways as these trains use less capacity on the railway. Overall adjusted operating expenses increased by 2.8%, well below adjusted revenue growth of 12.6%. We see room for optimisation in empty runs in FY19 as their share rose in FY18 due to container cargo flow misbalances. However, the recent increase can be explained by the geographical expansion of the company rather than by inefficiencies. The internationalisation process forces the company to spend on empty containers’ transportation from foreign countries. Over time, as the business grows, we see room for lower spending.
Reported net income grew 46% y-o-y to RUB9,509m. Excluding exceptional items (FX, gains from acquisitions/disposals), we calculate that net income increased 25% y-o-y to RUB7,794m.
Net debt was also significantly lower than our expectations (RUB1,779m vs RUB5,331m), due to both stronger than expected cash flow from operations and lower investments.
Forecasts raised: Revenues up 3%, net income c 20%
We have incorporated FY18 results into our model and raised forecasts for FY19 and FY20, with adjusted revenues up 3% and net income up c 20%. We also expect net debt to be significantly lower than before, mainly because of lower-than-expected capex in FY18.
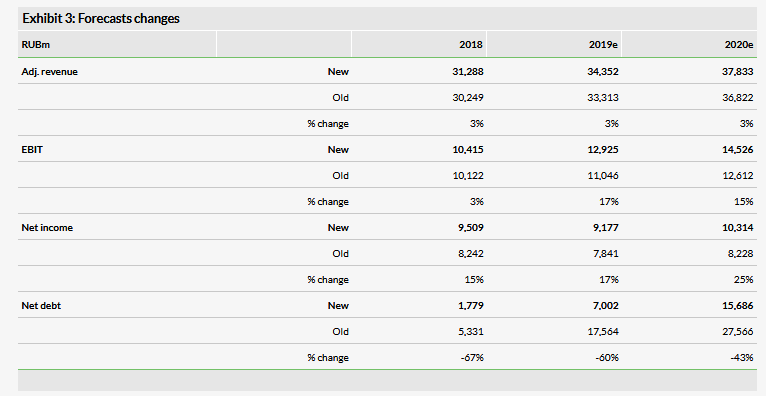
Our FY19 and FY20 estimates are based on an adjusted revenue CAGR (FY18–20) of 10% (which compares to an FY16–18 CAGR of 19%), reflecting continued volume growth translated into higher revenues for Integrated Freight Forwarding and Logistics Services. On the one hand, growth is driven by a supportive outlook for the Russian economy, with the World Bank estimating GDP expansion of 1.5% for 2019 and 1.8% for 2020. On the other hand, a structural trend towards containerisation should continue to represent a tailwind for TransContainer. According to company estimates, only 7.2% of Russia’s potentially containerisable rail cargo is transported in containers and although this figure rose from 2.2% in 2001 it is still much lower than in the US (18%), India (16%) and Europe (14%).
Higher revenues combined with a forecast small operating profit margin expansion (from 36.9% in FY18 to 38.4% in FY20e) are expected to drive a 12% operating profit CAGR, on our estimates. At the bottom line, this growth is partly offset by an increase in financial expenses (we expect a material increase in net debt, reflecting significant new investments). Management has previously said that capex will increase over the next years, mainly invested in new flatcars, to support an improved trading outlook (spending on flatcars stopped during the last recession). The company guides for RUB13.3bn capex in FY19, broadly double the level of FY18.
Valuation: Raised to RUB6,100/share
We have raised our valuation by 13% to RUB6,100/share, from RUB5,400/share, reflecting our higher profit forecasts and lower net debt. Hence, even following the recent pick-up in the share price, we see room for further upside. Our valuation is based on a DCF methodology, with unchanged assumptions of a WACC of 10.4% and a terminal growth rate of 1% (we obtain an EV of RUB91.9bn and an equity value of RUB84.9bn). As a sensitivity, a WACC that is higher/lower by two percentage points reduces/increases the valuation by RUB1,300/2,100 per share. Our valuation implies 5.7x FY19e EV/EBITDA and 9.3x FY19e P/E.
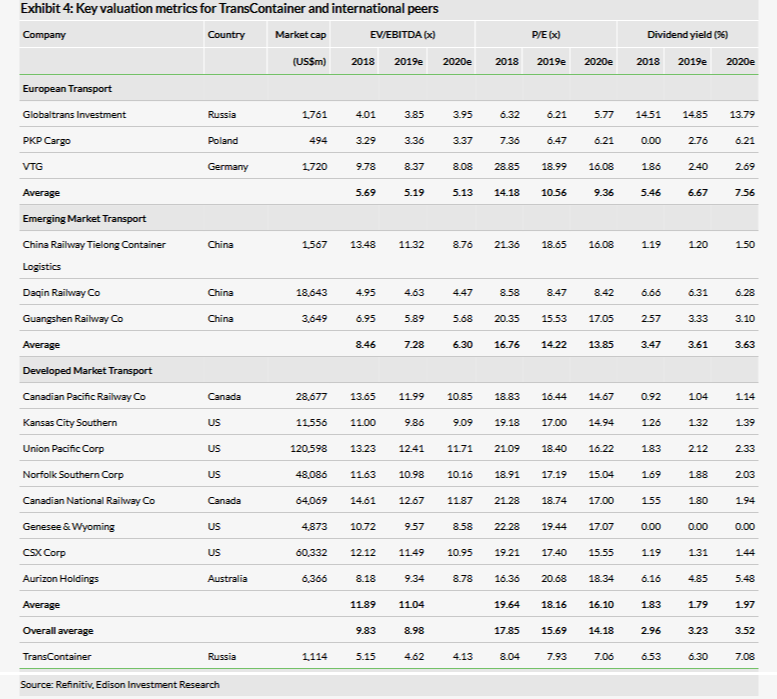
As shown in Exhibit 4, TransContainer is trading at a substantial discount to international peers, both in emerging markets and developed markets (albeit at a premium to Russian freight logistics company Globaltrans). We believe at least part of the discount to international peers reflects the limited liquidity, as well as a higher perceived country risk.
Key risks to our valuation are a stronger or weaker economic environment, higher or weaker than expected earnings margins and higher or lower than expected structural growth of the industry.
