
It’s difficult to understate the significance of recent market moves, but some historical perspective suggests things could get far worse before they improve.
A look at FX options market volatility prices shows traders predict the largest Japanese Yen moves since 2011 -- pretty significant. And yet a quick look at historical prices (chart below) shows that we’re still a fraction of the levels seen through the heights of the financial crisis in 2008.
In fact, the S&P 500 Volatility Index (VIX) hasn’t even hit its highest since last year, while our DailyFX 1-Month Volatility Index is similarly below 2012 peaks. Why might the next move be clear?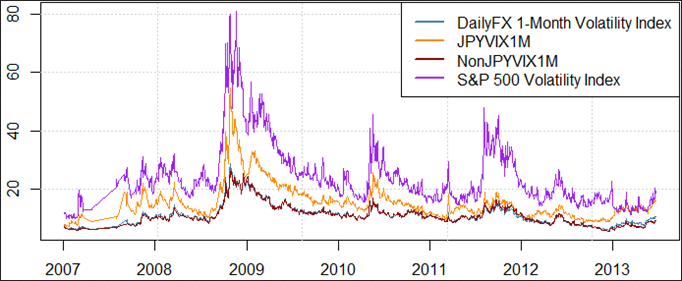
10-year US Government Treasury Notes saw their biggest 1-week decline in a decade (yields surged). Let’s think about that for a second: the world’s supposed foremost safe-haven asset is seeing truly historic sell-offs. That’s reason enough to believe that the S&P 500, major forex pairs, and other asset classes could continue to see big moves.
Past performance is not indicative of future results, but our sentiment-based trading strategies have done well in highly-volatile markets. That said, our go-to breakout trading strategy (Breakout2) has done less-well through last week’s choppy moves in key pairs.
Our major focus remains the Momentum2 strategy -- also known as the “Tidal Shift” system. It was named “Tidal Shift” because it was designed to catch major market reversals. It’s thus far caught some fairly substantial turns in the Dollar, Yen, and other pairs. There’s reason to believe it could continue to do well.
View the table below to see our strategy preferences broken down by currency pair.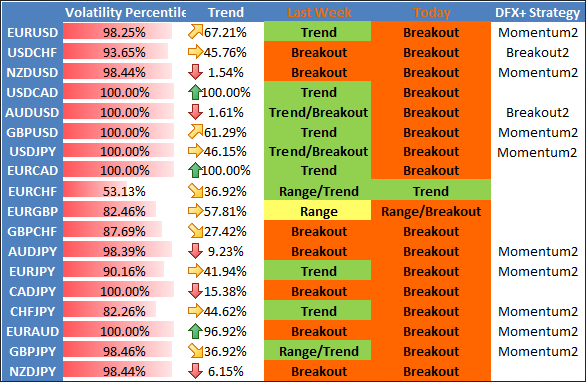
by David Rodriguez, Quantitative Strategist for DailyFX.com
Definitions
- Volatility Percentile: The higher the number, the more likely we are to see strong movements in price. This number tells us where current implied volatility levels stand in relation to the past 90 days of trading. We have found that implied volatilities tend to remain very high or very low for extended periods of time. As such, it is helpful to know where the current implied volatility level stands in relation to its medium-term range.
- Trend: This indicator measures trend intensity by telling us where price stands in relation to its 90 trading-day range. A very low number tells us that price is currently at or near 90-day lows, while a higher number tells us that we are near the highs. A value at or near 50 percent tells us that we are at the middle of the currency pair’s 90-day range.
- Range High: 90-day closing high.
- Range Low: 90-day closing low.
- Last: Current market price.
- Bias: Based on the above criteria, we assign the more likely profitable strategy for any given currency pair. A highly volatile currency pair (Volatility Percentile very high) suggests that we should look to use Breakout strategies. More moderate volatility levels and strong Trend values make Momentum trades more attractive, while the lowest Vol Percentile and Trend indicator figures make Range Trading the more attractive strategy.