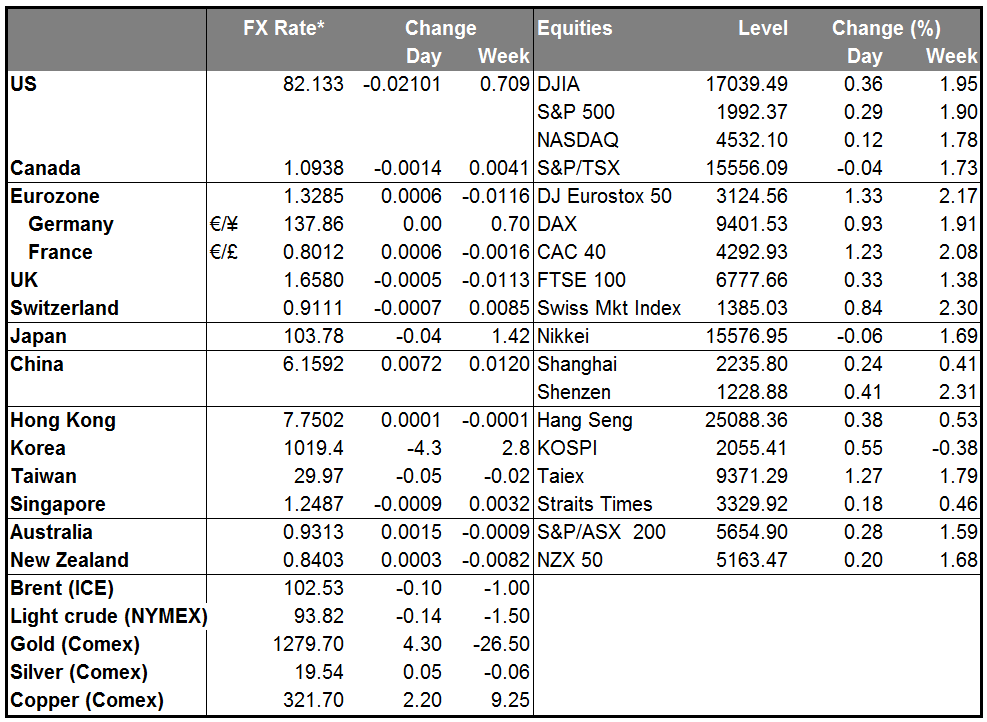
Dollar falls into Jackson Hole After several days of across-the-board gains, the dollar fell across the board yesterday. It was lower against all the G10 currencies and among the EM currencies we track, gained only against BLR and CNH. The weakness of the dollar was not justified by the economics, which were uniformly supportive: existing home sales, the Markit US manufacturing PMI, leading index and Philadelphia Fed business outlook were all higher than expected and higher than the previous month, while jobless claims were lower. The dollar’s weakness was therefore probably due to investors’ anticipation of dovish comments at today’s Jackson Hole economic conference (see below). In that respect, I think it will only be temporary and offers good opportunities for setting up long USD positions.
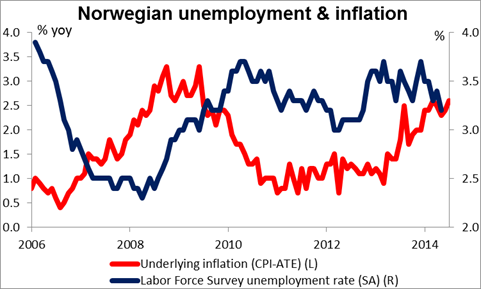
The best performing currency over the last 24 hours was the NOK, which soared yesterday after it was announced that the mainland economy expanded 1.2% qoq in Q2, more than double the 0.5% pace of Q1 and far exceeding estimates. It has managed to maintain the gains into today. The report only confirms the other recent solid news from Norway, including both one of the lowest unemployment rates and highest inflation rates in Europe. The next Monetary Policy Report, due out on Sep. 18th, should therefore have a fairly hawkish view (for Europe, at least) which is likely to keep the currency underpinned for now. I expect USD/NOK to test the 6.1300 zone, which is the 38.2% retracement of the 8th May- 6th August longer-term uptrend. A clear dip below 6.1300 would most likely trigger further extensions towards the key support of 6.1000.
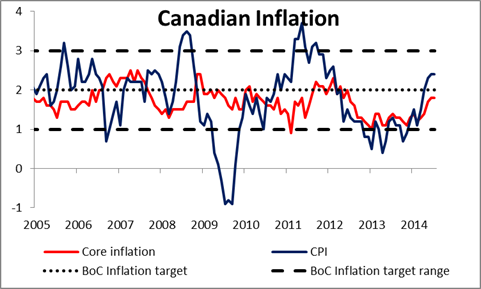
Today’s events: Friday’s calendar is very light. We have no major indicators coming out from Asia, Europe, the UK or the US, only Canada. The country’s CPI is forecast to slow to 2.2% yoy in July, from +2.4% yoy in the previous month and retail sales for June are expected to decelerate on a mom basis. CAD-negative
The most important event on Friday will be Fed Chair Janet Yellen’s keynote speech at Jackson Hole economic symposium. The theme this year is “Re-evaluating Labor Market Dynamics” and Yellen’s speech is simply titled “Labor Markets”. After Wednesday’s FOMC minutes, which revealed growing pressure from the hawks to begin hiking rates, investors’ attention will be focused on any possible change from her previous balanced comments regarding employment conditions, which emphasized both the progress made in reducing the unemployment rate and the contradictory message sent by other employment indicators, such as the large number of the long-term unemployed and sluggish wage growth (problems now summed up by the FOMC as “underutilization of labor resources”). However, I would not expect her to come out with much of a change in tone. Fed Chairs have used the Jackson Hole seminar in the past to send signals to the market, most recently in 2012, when Bernanke hinted that another round of quantitative easing was possible, as indeed happened a few weeks later. But the FOMC has been moving away from a “superstar” system and more towards a committee approach to making policy. In that respect, for the Chair to announce a major change in policy now – a few days ahead of an employment report (Sep. 5) and a couple of weeks ahead of an FOMC meeting (Sep. 16-17) might be considered “front running” the Committee. Having said that, the market is prepared for a neutral to dovish speech from Yellen, so such comments would probably not be market-affecting. The risk is that she says something more hawkish and takes the market by surprise.
ECB President Draghi will also be speaking at the seminar. With Europe’s unemployment rate stubbornly high, it will be interesting to hear what advice he has. The ECB has not released a title for his speech, which will be given over lunch.
The Market
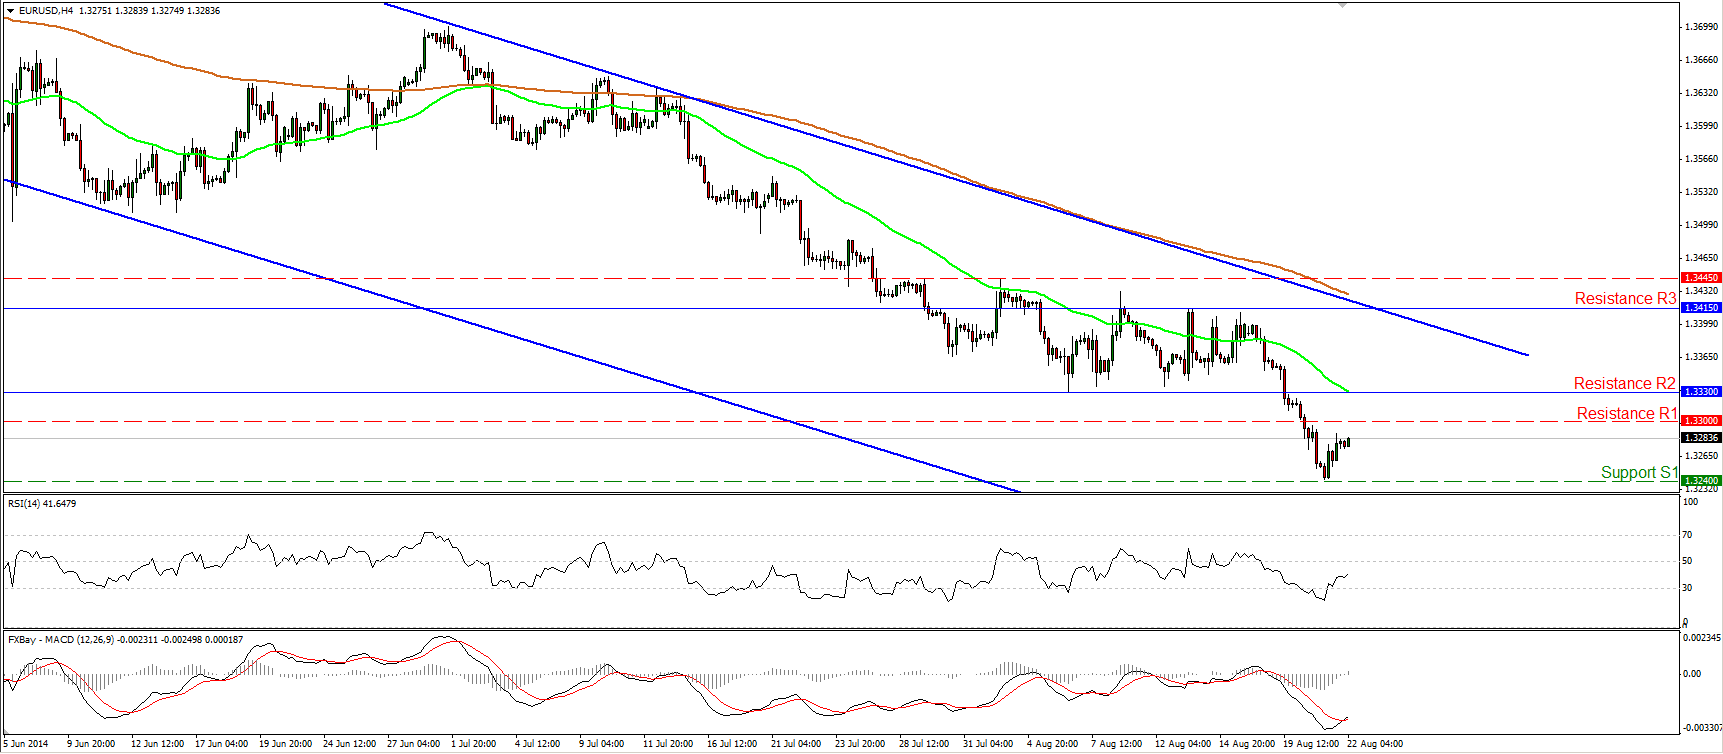
EUR/USD finds support at 1.3240
EUR/USD rebounded on Thursday, after Eurozone’s PMIs for August managed to remain above the 50 line, while Germany’s figures exceeded market expectations. The pair found support at 1.3240 (S1) and rebounded to trade slightly below the 1.3300 (R1) line. Our momentum signs suggest that the pair could continue to rebound, perhaps back above 1.3300 (R1). The RSI exited its oversold field and is now pointing its 50 line, while the MACD bottomed and moved above its signal line. Nevertheless, since the rate is trading within the downside blue channel, connecting the highs and the lows on the daily chart, I still consider the overall outlook to be negative and I would see yesterday’s rebound as a corrective move before sellers take the reins again. If Fed Chair Yellen sounds more optimistic today than we are used to, the rate may change course again and aim for the 1.3200 (S2) line, in my view.
• Support: 1.3240 (S1), 1.3200 (S2), 1.3100 (S3)
• Resistance: 1.3300 (R1), 1.3330 (R2), 1.3415 (R3)
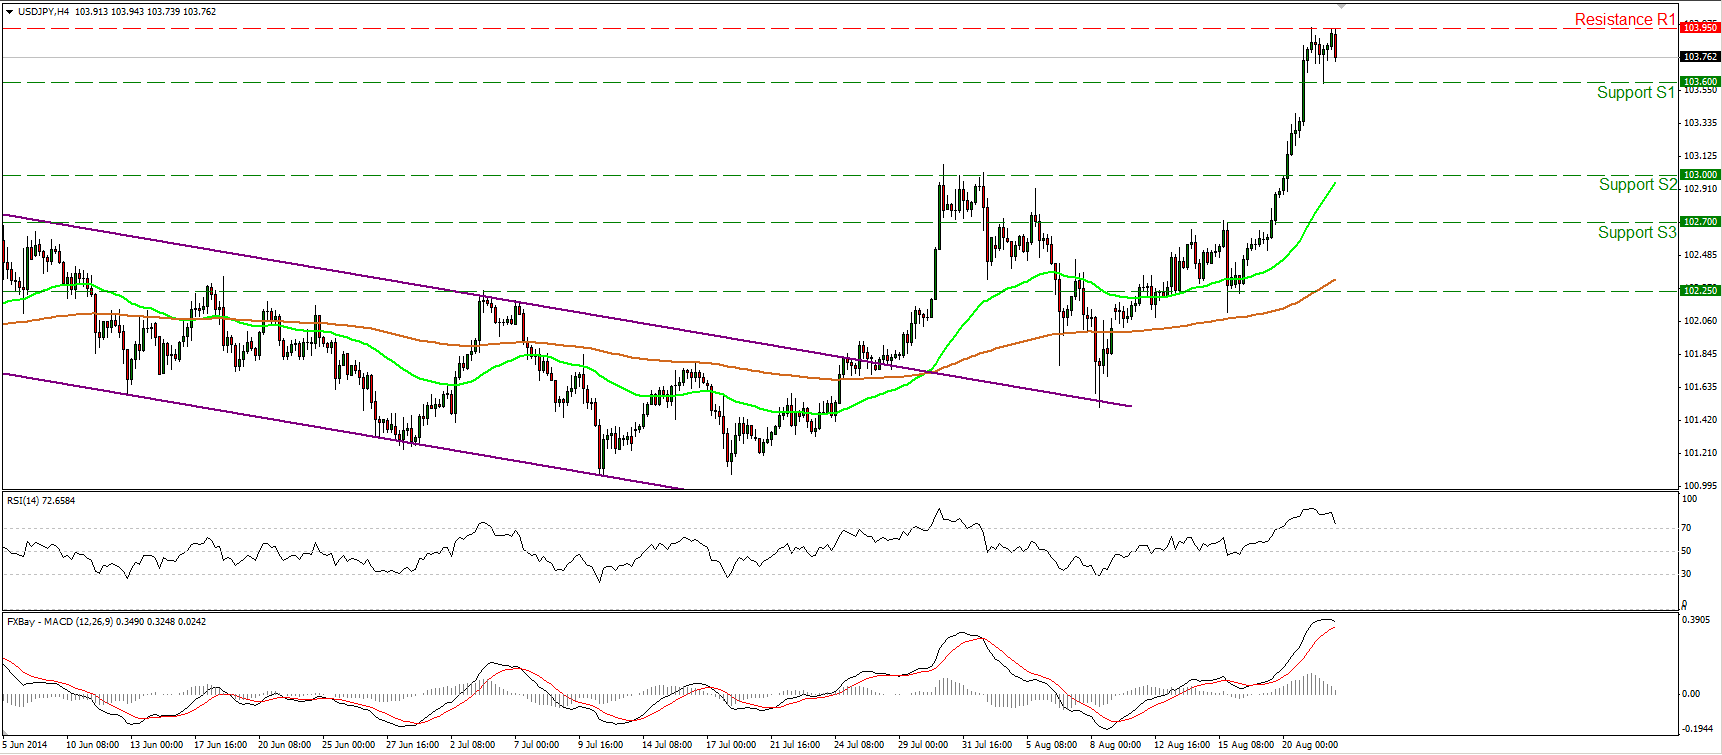
USD/JPY consolidates after hitting 103.95
USD/JPY surged on Wednesday, violating the 103.00 (S2) zone and finding resistance five pips below our barrier of 104.00. After consolidating below the 103.95 (R1) line, the pair retreated somewhat. Bearing in mind our momentum indicators and the fact that the rally was too steep, I expect the corrective wave to continue. The RSI, within its overbought area, is pointing down and seems willing to fall below 70 soon, while the MACD shows signs of topping and probably won’t take long before it falls below its trigger. Nevertheless, I still see a positive picture and I believe that a move above the 104.15 (R2) zone is likely to pull the trigger for extensions towards the next obstacle at 104.85 (R3).
• Support: 103.60 (S1), 103.00 (S2), 102.70 (S3)
• Resistance: 103.95 (R1), 104.15 (R2), 104.85 (R3)
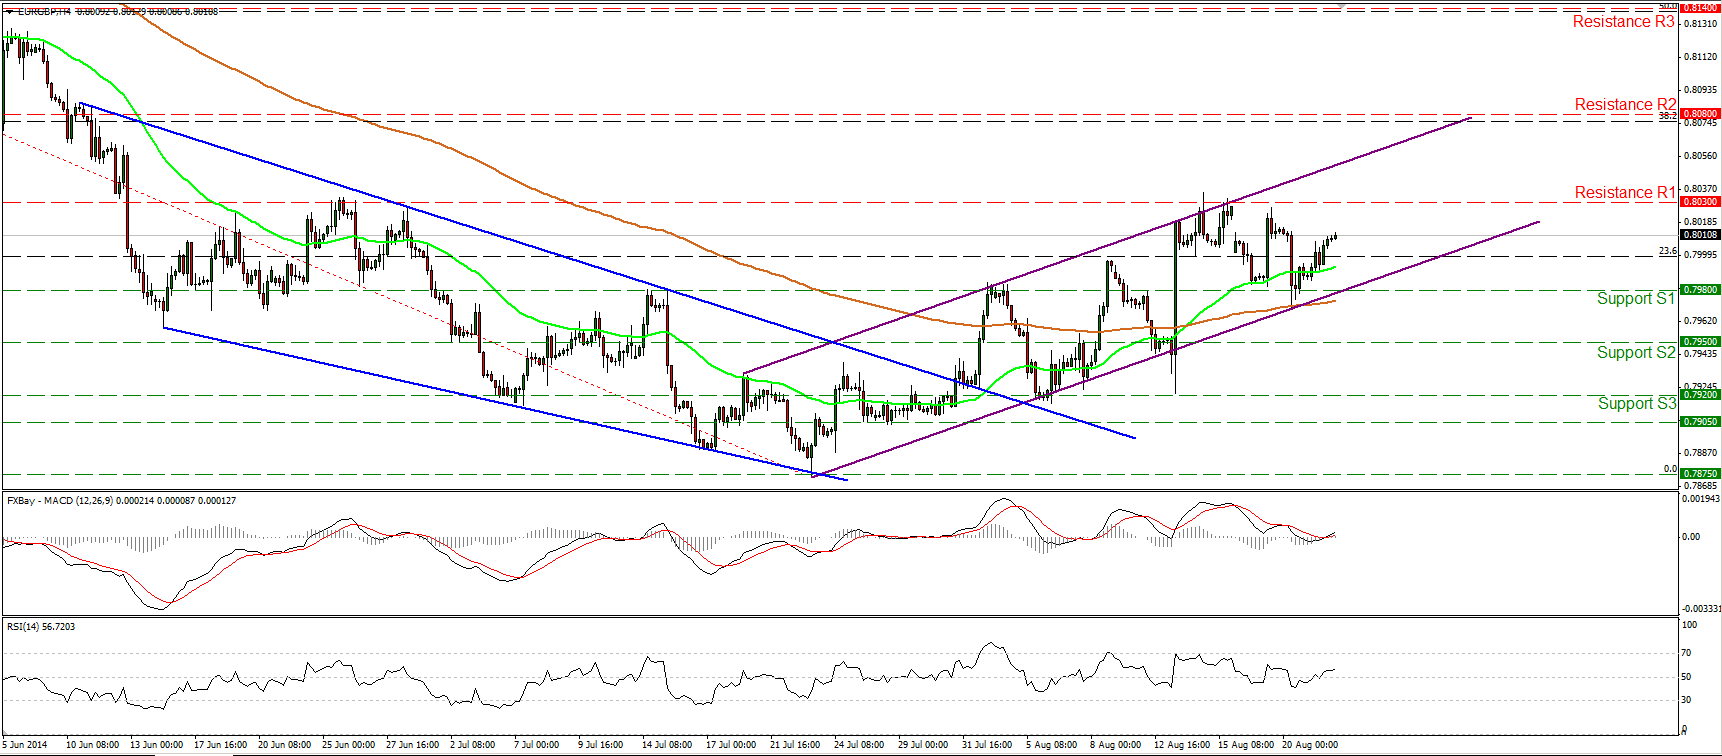
EUR/GBP rebounds from 0.7980
EUR/GBP rebounded from 0.7980 (S1) and the lower boundary of the purple upside channel on Wednesday, but today is still trading below its recent highs. The fact that the rate remains within the channel and is still trading above both the moving averages keeps the short-term path to the upside, but I would like to see a decisive move above 0.8030 (R1) before expecting further bullish extensions. Such a move could open the way for our next resistance bar at 0.8080 (R2), near the 38.2% retracement level of the 18th March – 23rd July longer-term downtrend. The RSI moved above its 50 line and is pointing somewhat up, while the MACD, after dipping below zero, is back positive and back above its signal line, confirming the recent bullish momentum.
• Support: 0.7980 (S1), 0.7950 (S2), 0.7920 (S3)
• Resistance: 0.8030 (R1), 0.8080 (R2), 0.8140 (R3)
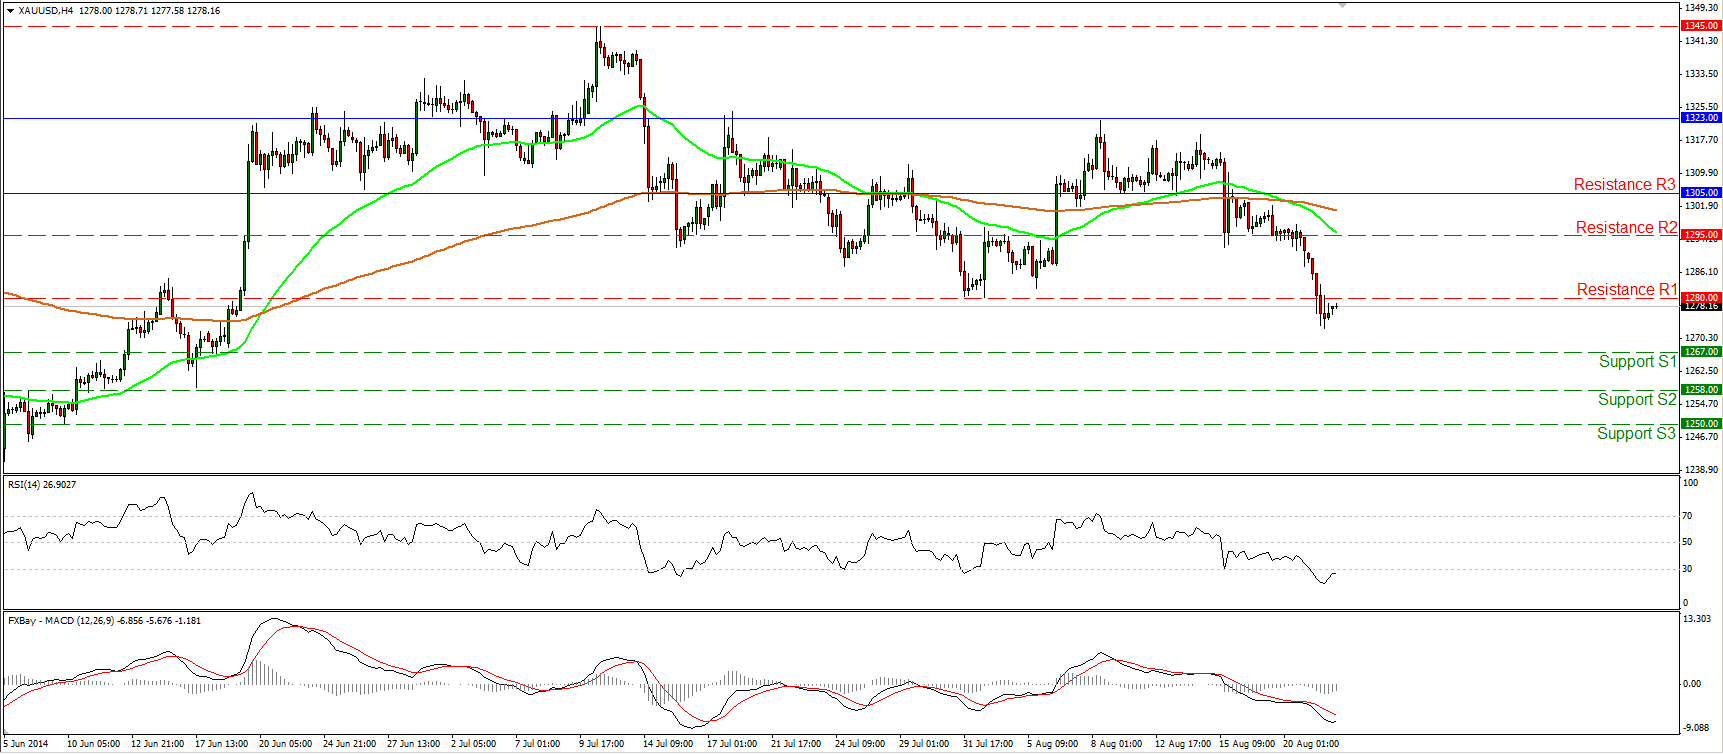
Gold reaches and breaks 1280
Gold continued moving down yesterday, reaching and breaking below our line of 1280 (support turned into resistance). Although we had a minor bounce after the break, I still see a negative short-term picture and I would expect the yellow metal to challenge hurdle of 1267 (S1) in the near future. The RSI lies within its oversold territory, near its 30 line, while the MACD, although below both its zero and signal line, shows signs of bottoming. Thus, I would be cautious on the continuation of the bounce before the next leg down takes place. On the daily chart, the 14-day RSI lies below 50, while the MACD left its neutral line and obtained a negative sign, confirming the last days’ bearish momentum of the price action.
• Support: 1267 (S1), 1258 (S2), 1250 (S3)
• Resistance: 1280 (R1), 1295 (R2), 1305(R3)
WTI fails to move below 92.60
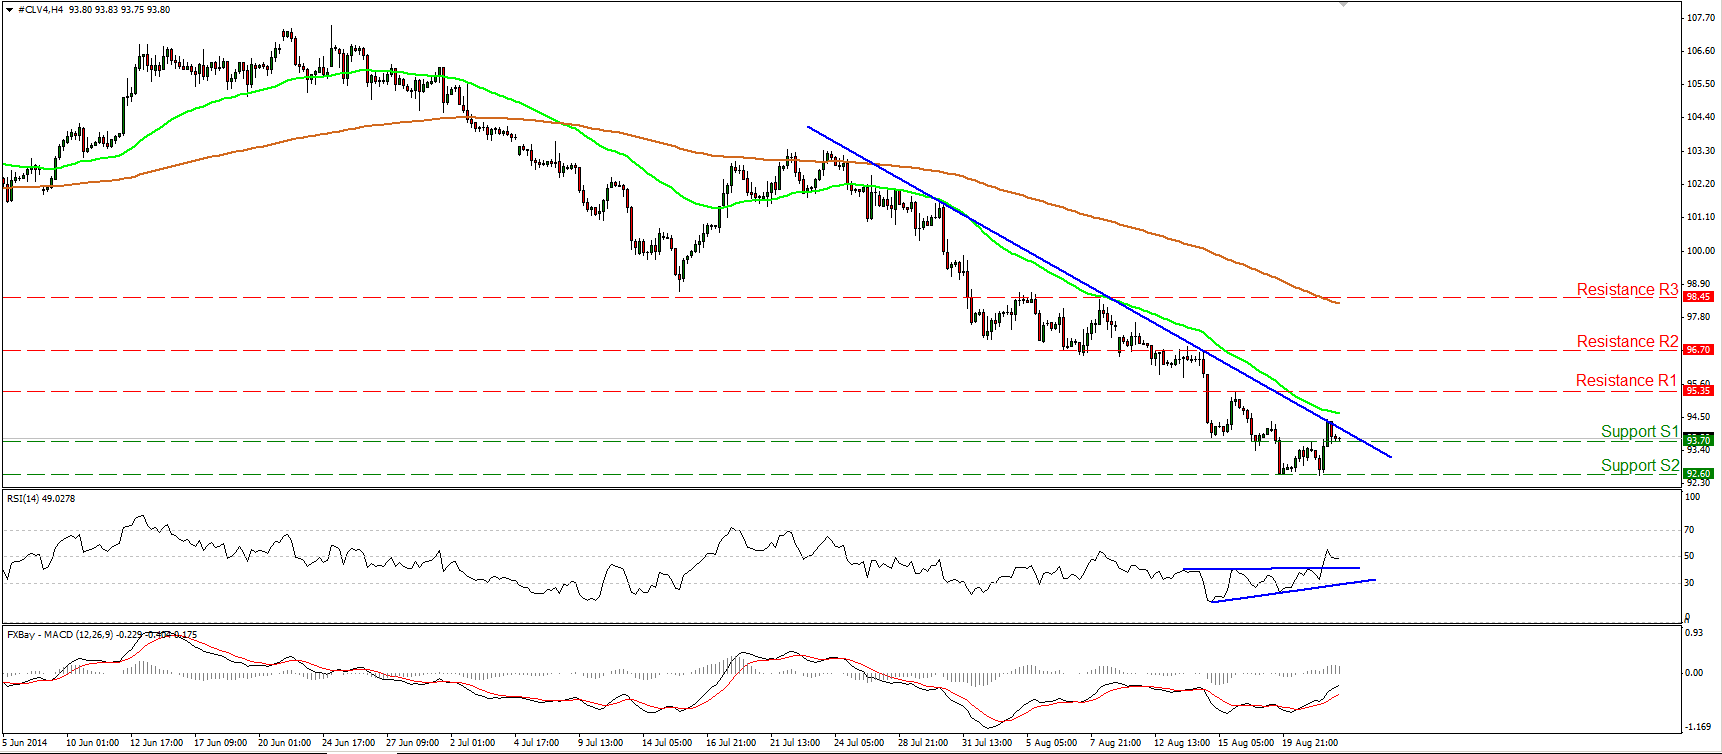
WTI found support again at 92.60 (S2) and moved higher to reach the near-term downtrend line. The fact that the price remains below the trend line and below both the moving averages keeps the short-term path to the downside. However, taking a look at our momentum indicators, I would prefer to maintain my flat view. The RSI broke above its resistance line, while the MACD lies above its trigger and is pointing up. Moreover, I still see positive divergence between the RSI and the price action. A price move above the trend-line and the resistance of 95.35 (R1) is likely to confirm the divergence and pave the way for the next resistance obstacle, at 96.70 (R2). On the other hand, we need a dip below 92.60 (S2) to have a forthcoming lower low and the continuation of the downside path.
• Support: 93.70 (S1), 92.60 (S2), 91.60 (S3)
• Resistance: 95.35 (R1), 96.70 (R2), 98.45 (R3)
BENCHMARK CURRENCY RATES - DAILY GAINERS AND LOSERS
MARKETS SUMMARY
Which stock should you buy in your very next trade?
AI computing powers are changing the stock market. Investing.com's ProPicks AI includes 6 winning stock portfolios chosen by our advanced AI. In 2024 alone, ProPicks AI identified 2 stocks that surged over 150%, 4 additional stocks that leaped over 30%, and 3 more that climbed over 25%. Which stock will be the next to soar?
Unlock ProPicks AI
