
Mr. Bernanke and the Federal Reserve met last week. Essentially, Mr. Bernanke and his colleagues decided to extend Operation Twist (program to reduce long-term interest rates) until the end of 2012. However, this was widely expected by markets.
Canada
The Canadian economic calendar is quite thin this week. The only important statistic to be released is the GDP of April on an annualized basis. Economists expect that a reading of 1.9% will be announced this Friday. With all eyes on Europe and the feeling of uncertainty about the current market conditions, a figure below expectations would push the US dollar to test important resistance levels.
United States
The multiple data flow expected this week in the US starts today with the consumer confidence index. With the many uncertainties on the domestic and international front (presidential elections in November, European problems, poor job creation, slow economic recovery), it will be interesting to know the feeling of American consumers. Wednesday, two key measures of economic activity will be known, the durable goods orders and the pending home sales, both for May. Thursday, the first-quarter GDP on an annualized basis will be unveiled. Economists estimate this figure to 1.9%, unchanged from the last reading. Friday we expect the personal consumption expenditure as well as the University of Michigan confidence index.
International
Besides the political developments that may hit the wires this week, here's what we will be watching. Wednesday, the German consumer price index for June will be known, followed by the Japanese Manufacturing Purchasing Manager for the same month. Thursday Germany’s employment data for the month of May and the eurozone consumer confidence index will be unveiled. Since Greece has given its place to Spain in the discussions surrounding Europe, it will be interesting to know the consumer sentiment in the euro area. Friday, will unveil its purchasing managers index data for the month of June. Let us remember that data below 50 show signs of economic contraction and that the last reading of this index was unveiled at 48.4.
Also Friday, the euro area’s consumer price index for June will be announced in annualized terms. Analysts expect inflation to be maintained at 2.4%. A statistic below this percentage would give more room to the European Central Bank to conduct a third round of long-term refinancing operation (LTRO) or another measure that would lead to the purchase of bonds. Also expected Friday, a two-day EU summit will conclude. If no progress towards a lasting solution to the European crisis emerges, market participants are likely to punish the stock markets and interest rates charged on sovereign debt. Spain’s borrowing cost will soar passed the dreaded 7% mark.
“A perfection of means, and confusion of aims, seems to be our main problem.” – Albert Einstein
European sovereign debt has been making the news for some time now, yet despite all the effort expended to date, a solution just seems to slip further out of reach with each passing day. Financial markets are in a holding pattern, given the inherent political obstacles, and at times this is baffling. Today we would like to draw your attention to contradictory behaviour in the markets, which are breaking the usual rule that riskier investments,require higher returns.
The graph on the left shows changes in the probability of a 50% default (i.e. the creditor recovers 50% of the,loan amount) for four different countries. This probability is derived from CDS prices, basically the price charged by the market as insurance against a country defaulting on its debt. France’s probability of default,(3.5%) is considerably higher than those of the other three countries: Germany (1.8%), the United Kingdom,(1.2%) and the U.S. (0.9%). It should be noted that Germany’s probability of default is 1.5 times as high as the United Kingdom’s and twice as high as the United States’.
The graph on the right presents the required rate of return, as of June 22, on the debt of these same countries. It is noteworthy that the required rate of return on Germany’s debt is slightly less than that required on the debt of the United Kingdom or the U.S.; in fact, Germany recently managed to float a debt issue with a 0% coupon! Higher risk, lower return…clearly, there is something strange going on in European risk valuations. Are capital flows coming out of southern European economies so focused on Germany as to lower the required rate on a temporary basis, to well below what would normally be required based on inherent risk? This is an interesting assumption. Investors are also clearly preparing to weather a storm from the Mediterranean. The situation calls for caution, even if it means sacrificing some return along the way!
Technical Analysis: EUR/USD (Friday, June 22, 2012, EUR/USD chart in monthly data)
EUR/USD: The long-term trend on the EUR/USD is still strongly bearish. The month of May 2012 was particularly nasty with a drop of nearly 1,000 points. The EUR/USD pair has been forming a series of lower highs and lower lows since 2008, a pattern usually seen in a market controlled by sellers. We note that each high printed a “tweezer” top (double top) and each low showed one or more doji patterns. At current levels, no sign of trend reversal is visible; rebounds are still corrective. The downtrend channel is still in place (blue). As for indicators, the RSI has moved above 65 since the 2008 crisis and un drop below 40 would be a negative sign. MACD has given a sell signal in September, 2011. In conclusion, the EUR/USD remains in a long-term bearish trend until proven otherwise. A drop towards is still likely.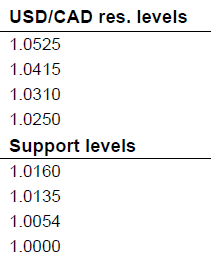 USD/CAD Support levels" title="USD/CAD Support levels" width="218" height="259">
Fixed Income
Bond and swap rates started on the rise last week, on speculation of monetary intervention from central banks, but ended almost unchanged as softer domestic inflation data suggested the Bank of Canada will likely not raise rates this year.
As expected on Wednesday, the Fed delivered fresh stimulus via an extension of Operation Twist, which is basically swapping short-term bonds for longer maturities in order to help generate a flatter yield curve and propel investments.
Canadian bond rates dropped on Thursday after a tightening in Canadian mortgage rules and weak economic data pushed investors to retreat from riskier asset classes.
Last Friday, the 1.5% increase in the May CPI was lower than economists’ expectations. Short bond yields decreased on the news, while longer maturities rose as optimism about a resolution to the eurozone debt crisis had more importance for global investors.
All eyes will be on the European summit in Belgium on Thursday. We’ll see if politicians are able to use this event as an opportunity to bring back market confidence. On the economic side, the will be watching closely the housing market news in Canada on Wednesday, as well as GDP data in the US on Thursday. 
Commodities
Last week, European economic concerns once again weighed down on the price of oil, which dropped 5% for,the week. We were riveted by stalled negotiations between Iran and the major Western powers; following two days of tense negotiations in Moscow, a new meeting has been scheduled for July 3 in Istanbul. The great powers are asking Iran to put an end to its enrichment program and close the Fordo facility. The potential for a,thawing of tensions between the two parties is slim, and the European Union will impose an oil embargo,against Iran as planned on July 1. The embargo will reduce Iran’s exports, obliging it to set aside an ever larger share of production. Given the country’s limited storage capacity, production may soon need to be curtailed. It is important to note that Iran is the fourth largest oil-producing nation in the world. The failed negotiations have certainly not reassured Israeli leaders, who have said that more stringent sanctions must be imposed and that a military attack may be necessary to counter the threat posed by Iran. Such a scenario is becoming more likely, and this could help underpin prices over the next few months.
Last Week At A Glance
Canada – In May, Canada’s consumer price index dipped 0.1% month over month, 0.2% in seasonally adjusted terms. Over 12 months, the all-items CPI was up 1.2%, compared with 2% the month before. Core CPI as measured by the Bank of Canada rose 0.2% in the month but was flat in seasonally adjusted terms. Compared with a year earlier, the core index was up 1.8%. Looking ahead, gasoline prices are down 2.4% in June and inflation from food, which accounts for 20% of core inflation in Canada, should be much lower than previously assumed. These developments combined with modest wage inflation (1.4% y/y in Q1 based on SEPH data) lead us to believe that the BoC’s rhetoric is likely to become less hawkish in the weeks ahead. In April, retail sales fell 0.5%, far more than expected by consensus. Sales were down in 8 of the 11 subsectors. In particular, auto dealerships saw revenues decrease 1.2%.
Excluding this segment, sales still sank 0.3%. Real consumption growth slipped below 1%,annualized in Q1 to a three-year low. Moreover, April's retail report suggests that consumer weakness has carried,over into Q2. Indeed, based on only the first month’s data, Q2 retail volumes are tracking at a growth rate of -3.1%,annualized their weakest level since 2009Q1. However, the relief enjoyed by consumers at the pumps in May and June might translate into better retail sales in those months. Still in April, wholesale trade rose a consensus-topping,1.5%. In real terms, it was up 1.3%. This should help offset soft factory sales in the month.
United States – In May, existing-home sales dropped 1.5% to an annual pace of 4.55 million units. The decline came on the heels of an upwardly revised pace of 4.62 million units in April. Distressed transactions as a share of,existing-home sales fell to 25% from 31% a year earlier. This significant decrease was reflected in the median home price, which jumped 7.9% from the year before. Housing starts retrenched in the month as well, retreating 4.8% to 708K from an upwardly revised 744K in April. However, building permits sprang 7.9% to 780K from an upwardly,revised 723K the prior month. The drop in U.S. housing starts needs to be placed into perspective, following as it did, a very strong month. The sharp increase in building permits suggests housing starts should bounce back sooner rather than later. In this regard, the NAHB home builders' confidence index for June recorded its highest reading in five years.
In June, the Philadelphia Fed index of manufacturing activity slid to -16.6, well below consensus,expectations for a zero print. This marks the index’s lowest point since August of last year. The new-orders subindex,slumped to -18.8 and the shipments sub-index pegged in at -16.6. The employment sub-index, however, climbed marginally, returning into positive territory at 1.8. All in all, though, the Philly Fed index was undoubtedly very disappointing. The FOMC released its latest economic projections. The central tendency GDP growth forecast,(Q4/Q4) for 2012 was revised down to a range of 1.9% to 2.4% (from 2.4% to 2.9% previously). Estimates were revised down also for 2013 (2.2%-2.8% vs. 2.7%-3.1%) and 2014 (3.0%-3.5% vs. 3.1%-3.6%). The unemployment rate forecast for 2012 was revised higher to 8.0%-8.2% from 7.8%-8.0%. More than half of the FOMC members now saw rates remaining below 1% through to 2014 (compared with 41% in April) and Operation Twist, which was due to wrap up this month, was extended to year end, over which time an additional $267 billion will be shifted from short-term to longer-term Treasurys.
- English (UK)
- English (India)
- English (Canada)
- English (Australia)
- English (South Africa)
- English (Philippines)
- English (Nigeria)
- Deutsch
- Español (España)
- Español (México)
- Français
- Italiano
- Nederlands
- Português (Portugal)
- Polski
- Português (Brasil)
- Русский
- Türkçe
- العربية
- Ελληνικά
- Svenska
- Suomi
- עברית
- 日本語
- 한국어
- 简体中文
- 繁體中文
- Bahasa Indonesia
- Bahasa Melayu
- ไทย
- Tiếng Việt
- हिंदी
FX Snapshot: Week Of June 25-29, 2012
Published 06/27/2012, 07:14 AM
Updated 05/14/2017, 06:45 AM
FX Snapshot: Week Of June 25-29, 2012
Major News this Week
Latest comments
Loading next article…
Install Our App
Risk Disclosure: Trading in financial instruments and/or cryptocurrencies involves high risks including the risk of losing some, or all, of your investment amount, and may not be suitable for all investors. Prices of cryptocurrencies are extremely volatile and may be affected by external factors such as financial, regulatory or political events. Trading on margin increases the financial risks.
Before deciding to trade in financial instrument or cryptocurrencies you should be fully informed of the risks and costs associated with trading the financial markets, carefully consider your investment objectives, level of experience, and risk appetite, and seek professional advice where needed.
Fusion Media would like to remind you that the data contained in this website is not necessarily real-time nor accurate. The data and prices on the website are not necessarily provided by any market or exchange, but may be provided by market makers, and so prices may not be accurate and may differ from the actual price at any given market, meaning prices are indicative and not appropriate for trading purposes. Fusion Media and any provider of the data contained in this website will not accept liability for any loss or damage as a result of your trading, or your reliance on the information contained within this website.
It is prohibited to use, store, reproduce, display, modify, transmit or distribute the data contained in this website without the explicit prior written permission of Fusion Media and/or the data provider. All intellectual property rights are reserved by the providers and/or the exchange providing the data contained in this website.
Fusion Media may be compensated by the advertisers that appear on the website, based on your interaction with the advertisements or advertisers.
© 2007-2025 - Fusion Media Limited. All Rights Reserved.