A major factor in remaining profitable trading currencies is recognizing the type of market you’re in. Mainly, is it a trending or mean reversing market?
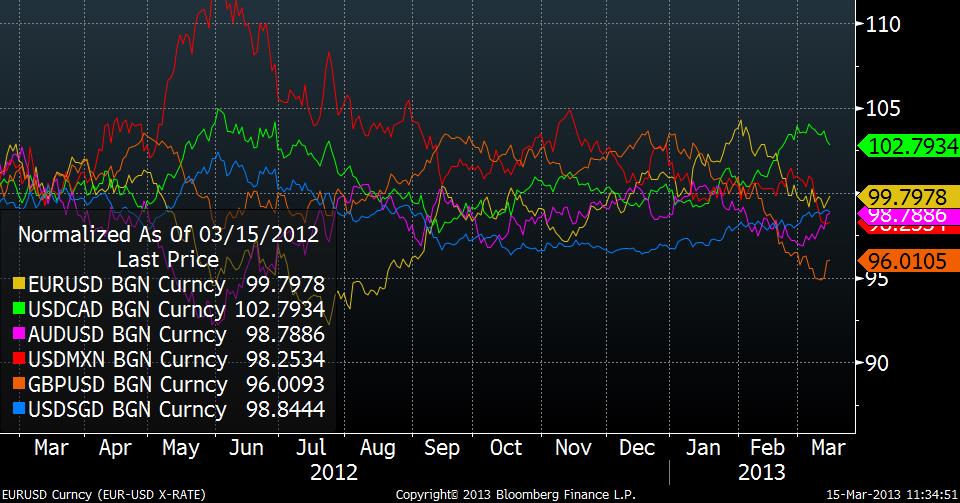
After examining a number of FX pairs, it is apparent that the answer depends on which currency pair you’re trading. The USD/MXN has been in a solid trend downwards since the summer of 2011, the AUD, CAD and SGD have been fluctuating within a range, and the GBP just recently broke out of its range to the downside.
Below is a normalized graph charting all of these currencies and their price action.

Is this price behavior likely to continue? A useful guide in answering this question is to examine the FX options market, which consists of sophisticated investors. Within the FX options market, there is an indicator known as risk reversal. This indicator show the price of calls relative to puts at the 25 delta level. Essentially, if it is a positive number, calls are more expensive than puts, demonstrating a upward bias, whereas if it is a negative number, puts are more expensive than calls, demonstrating a downward bias.
I’ve broken the charts into two, one with the USD as the base currency, and one with USD as the quote currency.
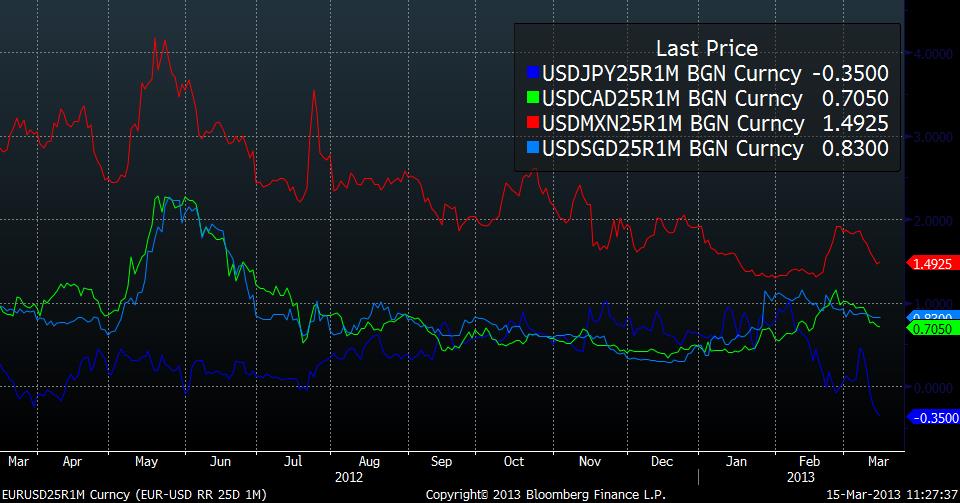
The chart below features risk reversal prices of the currency pairs with the USD as the base currency.

Interestingly, after an initial spike in call prices at the end of February, beginning of March, calls have become less expensive relative to puts (line going up indicates calls being bought which profit from a USD rally). Generally, a USD rally coincides with a “risk off” market move, therefore initially there was skepticism that the S&P500 would continue its climb and the VIX continue its fall at the beginning of the month. This concern appears to have largely subsided, with calls once again falling in value relative to puts.
The USD/JPY is a special case, as due to the recent rhetoric from the BOJ, its historic price action can be ignored as a new paradigm has emerged. In this case, the puts have become dramatically more expensive than the calls, which could be due to traders protect profits by buying downside protection, or forecasts for a pullback in the USDJPY. I expect the former being the larger contributing factor, as it is logical that many traders will want to insure their gains in the USD/JPY via the use of options.
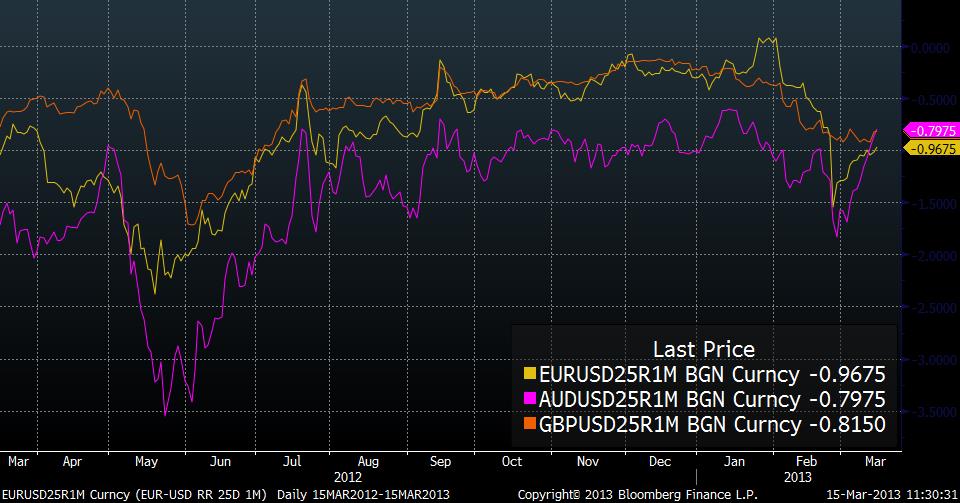
The chart below features the risk reversal prices of currency pairs with the USD as the quote currency.

These pairs’ price action correlates with the price action in the first risk reversal chart, although the lines on the chart will be reversed since the USD is in the quoted currency position. Once again, at the beginning of the month there was a large purchase of puts, indicating concern of a “risk off” move (USD rally). This fear has largely subsided in the AUD and EUR, both of which have seen a dramatic reversal, but the GBP hasn`t reversed at all, indicating further cause for concern.
Bottom Line
After initially being skeptical of the “risk on” move, FX options traders have bought into the rally. I take this as a sign that the rally is likely to continue in the short term, with the S&P 500 making new highs and risk on currencies such as the AUD, MXN and CAD to rally. This information also indicates that the EUR is expected reverse its recent fall and continue the uptrend it has been in since the summer of 2012, and that the GBP is expected to continue its fall.
After examining a number of FX pairs, it is apparent that the answer depends on which currency pair you’re trading. The USD/MXN has been in a solid trend downwards since the summer of 2011, the AUD, CAD and SGD have been fluctuating within a range, and the GBP just recently broke out of its range to the downside.
Below is a normalized graph charting all of these currencies and their price action.

Is this price behavior likely to continue? A useful guide in answering this question is to examine the FX options market, which consists of sophisticated investors. Within the FX options market, there is an indicator known as risk reversal. This indicator show the price of calls relative to puts at the 25 delta level. Essentially, if it is a positive number, calls are more expensive than puts, demonstrating a upward bias, whereas if it is a negative number, puts are more expensive than calls, demonstrating a downward bias.
I’ve broken the charts into two, one with the USD as the base currency, and one with USD as the quote currency.
The chart below features risk reversal prices of the currency pairs with the USD as the base currency.

Interestingly, after an initial spike in call prices at the end of February, beginning of March, calls have become less expensive relative to puts (line going up indicates calls being bought which profit from a USD rally). Generally, a USD rally coincides with a “risk off” market move, therefore initially there was skepticism that the S&P500 would continue its climb and the VIX continue its fall at the beginning of the month. This concern appears to have largely subsided, with calls once again falling in value relative to puts.
The USD/JPY is a special case, as due to the recent rhetoric from the BOJ, its historic price action can be ignored as a new paradigm has emerged. In this case, the puts have become dramatically more expensive than the calls, which could be due to traders protect profits by buying downside protection, or forecasts for a pullback in the USDJPY. I expect the former being the larger contributing factor, as it is logical that many traders will want to insure their gains in the USD/JPY via the use of options.
The chart below features the risk reversal prices of currency pairs with the USD as the quote currency.

These pairs’ price action correlates with the price action in the first risk reversal chart, although the lines on the chart will be reversed since the USD is in the quoted currency position. Once again, at the beginning of the month there was a large purchase of puts, indicating concern of a “risk off” move (USD rally). This fear has largely subsided in the AUD and EUR, both of which have seen a dramatic reversal, but the GBP hasn`t reversed at all, indicating further cause for concern.
Bottom Line
After initially being skeptical of the “risk on” move, FX options traders have bought into the rally. I take this as a sign that the rally is likely to continue in the short term, with the S&P 500 making new highs and risk on currencies such as the AUD, MXN and CAD to rally. This information also indicates that the EUR is expected reverse its recent fall and continue the uptrend it has been in since the summer of 2012, and that the GBP is expected to continue its fall.