Forex News and Events:
EM still in demand
Despite the slight pullback in stock, the US is still leading the risk-on environment with solid equity gains. With monetary easing from the ECB next week (see below), contraction in volatility and yields globally, EM should continue to perform. Within FX, carry fuel trades continued to should solid returns. We remain vigilant for any potential catalyst for a wide spread carry unwind, the near term looks devoid of any triggers (especially with the ECB heading towards easing). In this context of high yielder, USD/INR remains one of our top trades. From a fundamental perspective India continues to improve. India’s volatile current account deficit is in a steady trend of contraction (Jan-March deficit at $1.20bn) and PMI readings are near or above expansion territory. In addition pro-business BJP party decisive victory will further attract portfolio inflows. With the next RBI policy meeting scheduled for June 3rd , the central bank will likely maintain the high interest rate to keep inflation in check rather than shift to support near term weak growth areas. As long as the INR appreciation is controlled, a heavy hand by the RBI is unlikely.
Big expectations for ECB
Looking forward the key event next week will be the European central bank policy meeting. Measuring ECB speak it seems that Draghi is preparing for some type of policy action, however risk of disappointment is high. The highest probability event is for a 10bp-15bp rate cut (refi and depo) which seems to be fully priced by the market. We also view the adding of measures to encourage extension of credit aimed at banks (FLS/LTRO) a significant possibility, and would provide a small surprise. But the announcement that would illustrate that the ECB is ready to take critical steps to stave-off deflation with large-scale American style asset purchases looks unlikely (estimates of size starts at €1trn). So a mild cut in rates plus measure to support short ended liquidity is the high probability results and is unlikely to impress the market. The lack of innovation and commitment by the ECB is likely to lead to a cutting of EUR shorts in the near term. EUR strengthens particularly due to the widening between the ECB and Fed balance sheets. The ECB balance sheet has been contracting due to LTRO repayments, while the Fed continues to buy bonds. There is a real apprehension within the ECB for balance sheet expansion, so while adjusting interest rates might have a minor effect, unless Europe unchains QE there will be limited impact on Euro strength.

Today's Key Issues (time in GMT):
2014-05-30T07:00:00 CHF May KOF Leading Indicator, exp 102.1, last 102, rev 101.82014-05-30T07:30:00 SEK 1Q GDP QoQ, exp 0.00%, last 1.70%
2014-05-30T07:30:00 SEK 1Q GDP WDA YoY, exp 2.30%, last 3.10%
2014-05-30T08:00:00 NOK 1Q Manufacturing Wage Index QoQ, last 1.30%
2014-05-30T08:00:00 NOK Jun Norges Bank Daily FX Purchases, exp 0M, last 0M
2014-05-30T12:30:00 CAD 1Q Quarterly GDP Annualized, exp 1.80%, last 2.90%
2014-05-30T12:30:00 CAD Mar GDP MoM, exp 0.10%, last 0.20%
2014-05-30T12:30:00 CAD Mar GDP YoY, exp 2.30%, last 2.50%
2014-05-30T12:30:00 CAD Apr Industrial Product Price MoM, exp 0.40%, last 0.40%
2014-05-30T12:30:00 CAD Apr Raw Materials Price Index MoM, exp 0.50%, last 0.60%
2014-05-30T12:30:00 USD Apr Personal Income, exp 0.30%, last 0.50%
2014-05-30T12:30:00 USD Apr Personal Spending, exp 0.20%, last 0.90%
2014-05-30T12:30:00 USD Apr PCE Deflator MoM, exp 0.20%, last 0.20%
2014-05-30T12:30:00 USD Apr PCE Deflator YoY, exp 1.60%, last 1.10%
2014-05-30T12:30:00 USD Apr PCE Core MoM, exp 0.20%, last 0.20%
2014-05-30T12:30:00 USD Apr PCE Core YoY, exp 1.40%, last 1.20%
2014-05-30T13:00:00 USD May ISM Milwaukee, exp 52, last 47.26
2014-05-30T13:45:00 USD May Chicago Purchasing Manager, exp 61, last 63
2014-05-30T13:55:00 USD May F Univ. of Michigan Confidence, exp 82.5, last 81.8
The Risk Today:
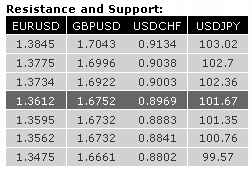
EUR/USD has broken the key support area between 1.3673 and 1.3643. The short-term technical structure calls for further weakness as long as prices remain below the resistance at 1.3669 (27/05/2014 high). Another resistance lies at 1.3734 (19/05/2014 high). A support stands at 1.3562 (12/02/2014 low). In the longer term, the break of the long-term rising wedge (see also the support at 1.3673) indicates a clear deterioration of the technical structure. The downside risk implied by the double-top formation is 1.3379. Key supports can be found at 1.3477 (03/02/2014 low) and 1.3296 (07/11/2013 low).
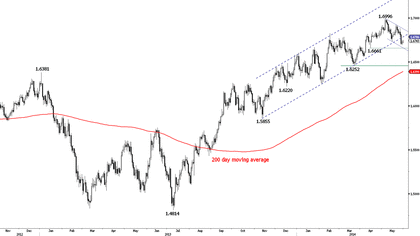
GBP/USD has broken its long-term rising channel, confirming a larger corrective phase. Monitor the key support at 1.6661. Hourly resistances can be found at 1.6783 (27/05/2014 low) and 1.6882 (27/05/2014 high, see also the declining channel). In the longer term, despite the break of the long-term rising channel, the lack of significant bearish reversal pattern suggests a limited downside risk. Indeed, the current weakness is looking like a classic "zig-zag" (or A-B-C) correction. As a result, a medium-term bullish bias remains favoured as long as the support at 1.6661 (15/04/2014 low) holds. A major resistance stands at 1.7043 (05/08/2009 high).
USD/JPY has thus far failed to move significantly above the 38.2% retracement (102.09) of the decline from April, indicating a weak buying interest. Monitor the support at 101.35 (see also 61.8% retracement of the recent bounce), as a break would call for a new test of the key support at 100.76. Resistances stand at 102.14 and 102.36 (13/05/2014 high). A long-term bullish bias is favoured as long as the key support 99.57 (19/11/2013 low) holds. Monitor the support area provided by the 200 day moving average (around 101.39) and 100.76 (04/02/2014 low). A major resistance stands at 110.66 (15/08/2008 high).
USD/CHF has broken the key resistance at 0.8953, confirming a persistent buying interest. A short-term bullish bias is favoured as long as the support at 0.8924 (22/05/2014 low) holds. Another support stands at 0.8883 (15/05/2014 low). Monitor the resistance implied by the 200 day moving average (around 0.8986). Another resistance can be found at 0.9038 (12/02/2014 high). From a longer term perspective, the bullish breakout of the key resistance at 0.8953 suggests the end of the large corrective phase that started in July 2012. The upside potential implied by the double-bottom formation is 0.9207. A key resistance stands at 0.9156 (21/01/2014 high).

