If last week was dominated by Draghi, then this week is sure to focus on the Fed.
While it’s widely anticipated that the US central bank will hike rates on Wednesday, there remains plenty of scope for the Fed to move the market.
Traders will be transfixed on Fed Chair Janet Yellen’s every word, especially regarding the pace of future rate rises and the impact of a Trump presidency on economic projections.
Let’s take a closer look at where the balance of supply and demand lies within the major FX pairs.
EUR/USD
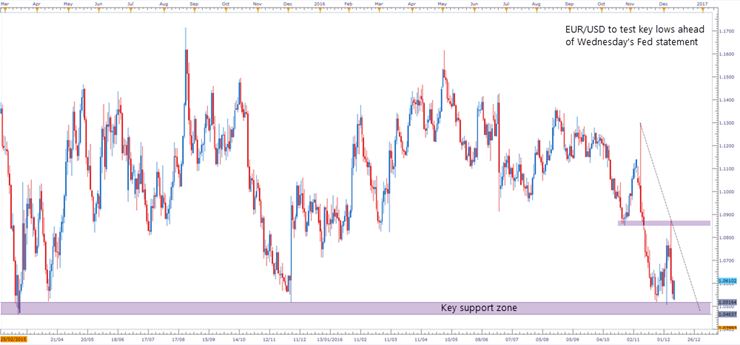
Last Thursday’s ECB rate decision and policy statement sparked a sharp reversal in EUR/USD.
The market is now faced with a key zone of support created by the March 2015 and December 2015 lows. How the market responds to this critical structure level is likely to shape the dynamics of the market well into next year.
A decisive break below support following Wednesday’s Fed statement would not be surprising. However, at such a key level, it’s always wise to be weary of false breakouts and bear traps.
Daily EUR/USD Candle Chart

GBP/USD
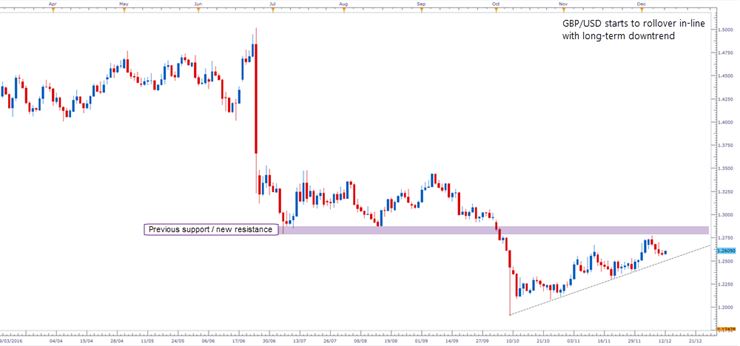
Cable’s post ‘flash crash’ recovery is starting to wane…
Having retraced all the way back up into previous structural support, prices have started to rollover. That said, technicals are likely to play second fiddle to newsflow volatility this week with both the Fed and BoE making rate decisions on Wednesday and Thursday respectively.
GBP/USD Daily Candle Chart

USD/JPY
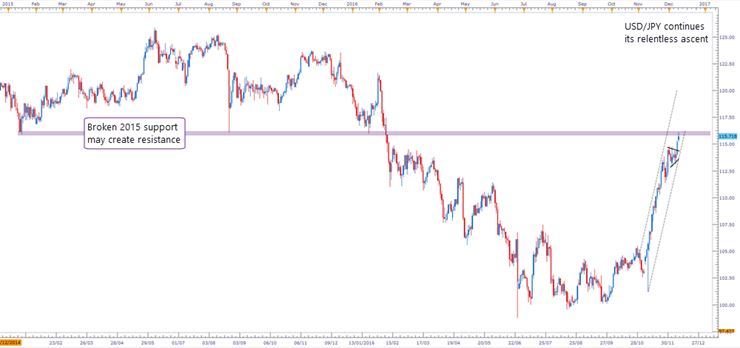
USD/JPY’s relentless ascent following the Trump election win continues to gather momentum.
Having spent much of last week consolidating inside a small bull-flag formation, prices are once again in ‘range expansion mode’.
The market is now faced with a key area of resistance, which represents a broken support zone that held firm for much of 2014/2015. It remains to be seen whether this resistance zone will slow the pace of USD/JPY’s uptrend.
USD/JPY Daily Candle Chart

AUD/USD
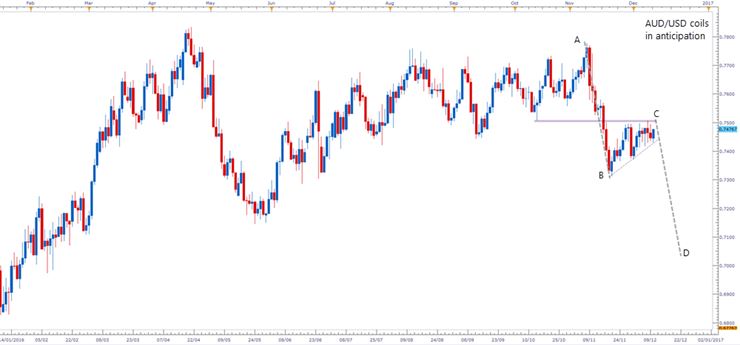
The Aussie is a market under intense price compression.
A series of tight trading ranges has seen the market coil between an ascending trendline and a horizontal level of resistance. This ‘volatility contraction’ signals that the market is gearing up for a strong directional move.
Given the strength of the sell-off preceding the recent consolidation we favour a break to the downside in-line with a harmonic A,B,C,D formation.
AUD/USD Daily Candle Chart

