As the dust starts to settle from the US election here’s a technical snapshot of the major FX pairs.
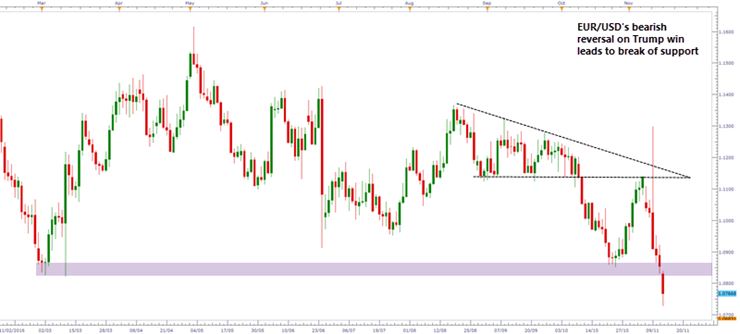
Wednesday’s post-election ‘pop and drop’ knocked the stuffing out of EUR/USD bulls.
The 400 point intra-day reversal evolved into a sustained sell-off which has culminated in prices breaking below support this morning.
Putting the technicals to one side for a moment, it’s worth mentioning that EUR/USD’s underlying fundamentals are deteriorating fast…
Last week’s shock Trump win points to an uprising in populist politics. This is bad news for the Eurozone which has an Italian referendum and a French election to deal with. When you combine this political uncertainty with the policy divergence between the Fed and the ECB, it paints a pretty ugly picture.
With prices looking a touch stretched to the downside we could really do with a healthy period of mean reversion. Any retracement back up into the broken support zone at 1.0825 should be viewed as a selling opportunity.

The pound is performing well in the post-election environment.
Last week's shock Trump win is seen to have put the UK at the front of the queue when it comes to negotiating a trade deal with the US. So whilst the greenback strength has got much of the limelight, the pound is also showing high levels of relative strength.
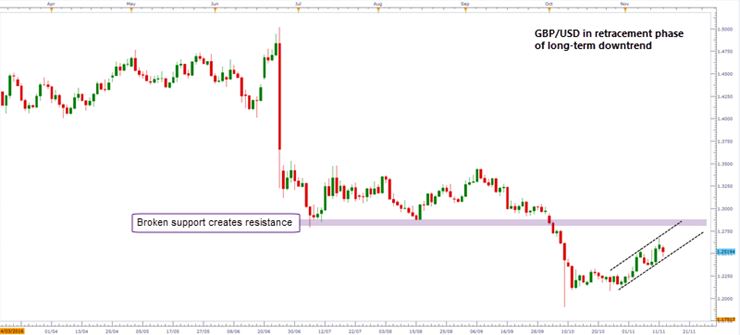
Despite the pound’s strength this market is in the ‘retracement phase’ of a long-term downtrend. We expect the broken support zone at 1.2820 to create a key barrier of resistance which is likely to cap any retracement potential.

GBP/USD Daily Candle Chart
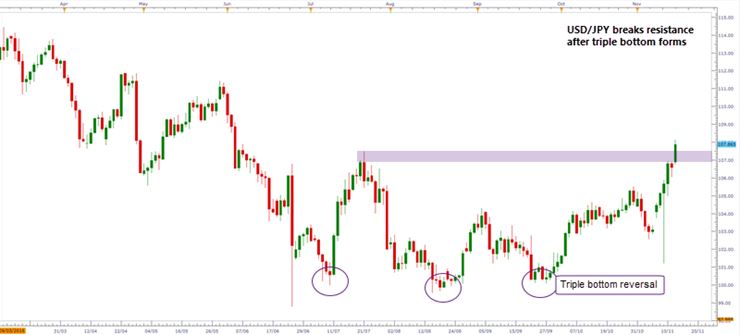
Much like EUR/USD, USD/JPY underwent a gigantic intra-day reversal on Wednesday.
Traders initial scramble into safe havens following Wednesday’s Asian session ‘Trump dump’ proved to be a bear trap as USD/JPY surged higher.
In terms of market dynamics this pair is particularly intriguing right now. Today’s break through 107.50 resistance is significant as it lays the foundation for a change in trend.
Should prices hold their gains during the next consolidation phase we would look to align ourselves with the bullish short-term momentum.

USD/JPY Daily Candle Chart
The overriding US dollar strength that we witnessed towards the end of last week has left the Aussie looking vulnerable.
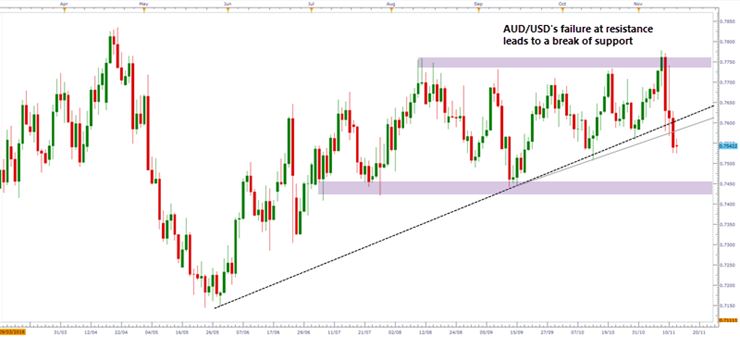
Failure to break through resistance at 0.7760 sparked a sharp sell-off which has shifted momentum in favour of the bears.
Prices broke and closed below both horizontal and dynamic support lines confirming the change in market dynamics.
Whilst Tuesday’s RBA minutes are sure to create some volatility, a retest of the 0.7450 support zone looks to be the most likely destination.

