Recent trade war tensions seem to have abated as President Xi's grown-up stance on global trade has soothed volatile stock markets. FX markets are not so sanguine on USD though, as geopolitics and US domestic politics continue to hurt the dollar, amongst its wider long-term issues.
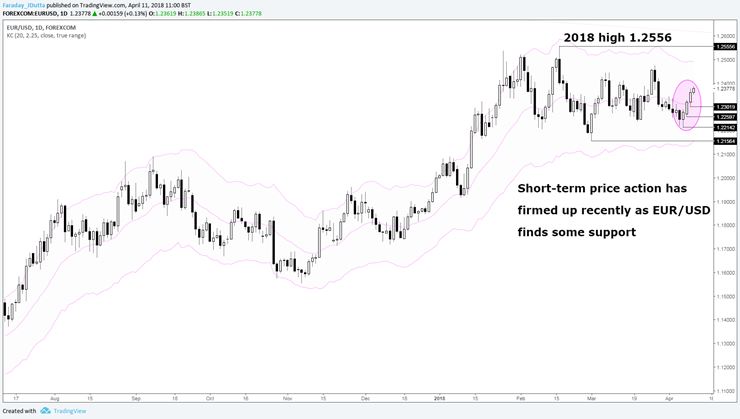
We highlighted the contracting ranges on the weekly and daily charts in EUR/USD at the start of the week - only once in the history of EUR has this major posted a net weekly change of less than 0.6% for 7 weeks. Price compression normally precedes price expansion and the single currency is currently up 0.76% this week. This rally, on the back of hawkish comments by an ECB hawk yesterday, has taken prices away from the lower support levels of the medium term consolidation range. We still look to be stuck in a range though with the hawks at the ECB battling any Fed signals of a fourth rate hike this year.

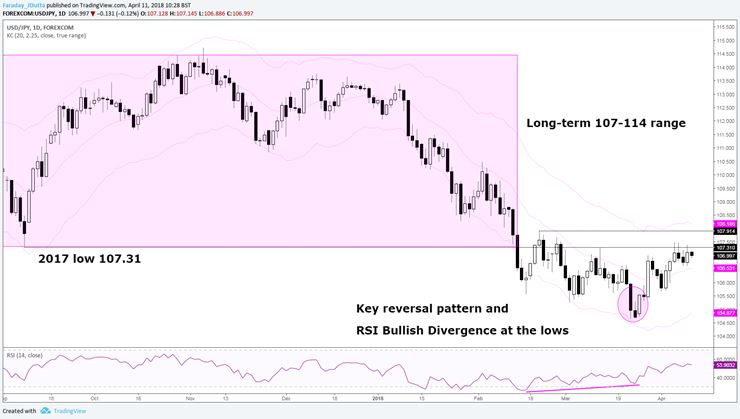
Risk on demand for USD/JPY has offset some of the broad based selling in USD which has been a significant factor this week - hence the tight range ‘doji’ weekly candle so far! Having broken out of a multi-month range through last year’s lows at the start of February, the pair looks to be forming a base with notable bullish divergence on the RSI. The key reversal pattern around the end of March see prices still stuck below 107.31. The zone around here and 107.91 may represent a tough resistance area to crack in the near term.

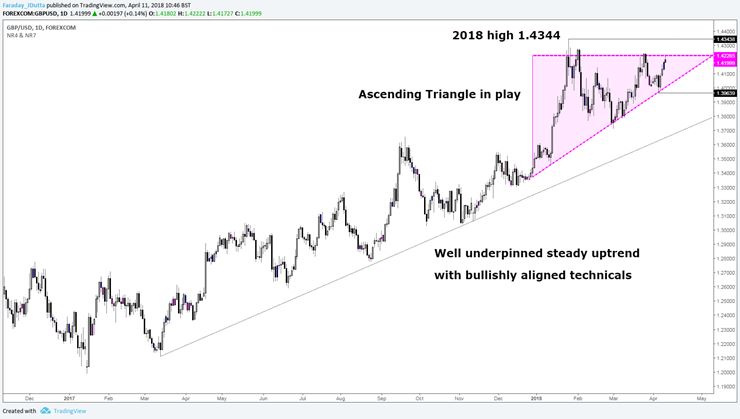
Cable is firm with GBP the best performing major over the last 30 days. A broad ascending triangle looks to be playing out with March highs around 1.4243 to contend with next, on its way to this year’s highs. A solid ‘buy on dips’ strategy should continue to work well from a technical perspective. That said, we note the 86% pricing by markets of a May hike currently and together with recent positive Brexit news, a break to new highs may prove more difficult.

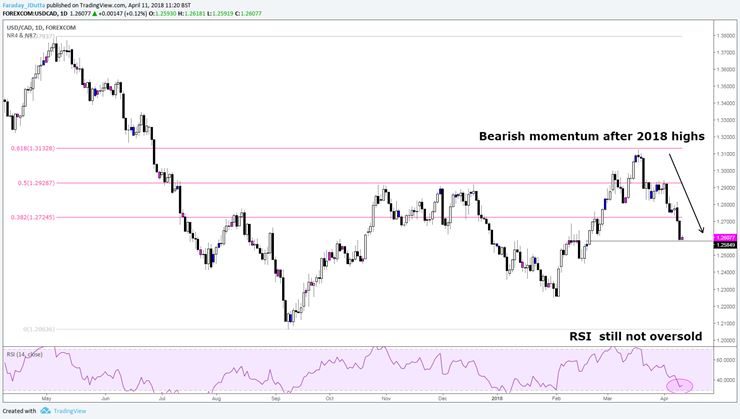
After a rough start to the year, the loonie is now the second strongest major currency over the last month, supported by signs of a thaw in NAFTA negotiations and the recent rally in oil. Retracement levels from the May 2017 highs to September lows have worked well over the last few months. However, this week has seen prices plunge through the 38.2% Fib level at 1.2724 and momentum signals remain bearish with the daily RSI still just below 40. Resistance is now that Fib level whilst downside targets come in around 1.2585.

