According to Yahoo Finance, Fusion-io (FIO), " engages in the development, marketing, and sale of storage memory platforms for data decentralization in the United States."
The goal with this scan is to identify short-term implied vol (IV30™) that is depressed both to the recent stock movement (HV20™) and the long term trend in stock movement (HV180™). I'm also looking for a reasonable amount of liquidity in the options (thus the minimum average option volume), want to avoid bio-techs (and their crazy vol) and make sure I'm not purchasing depressed IV30™ relative to HV20™ simply because of a large earnings move.
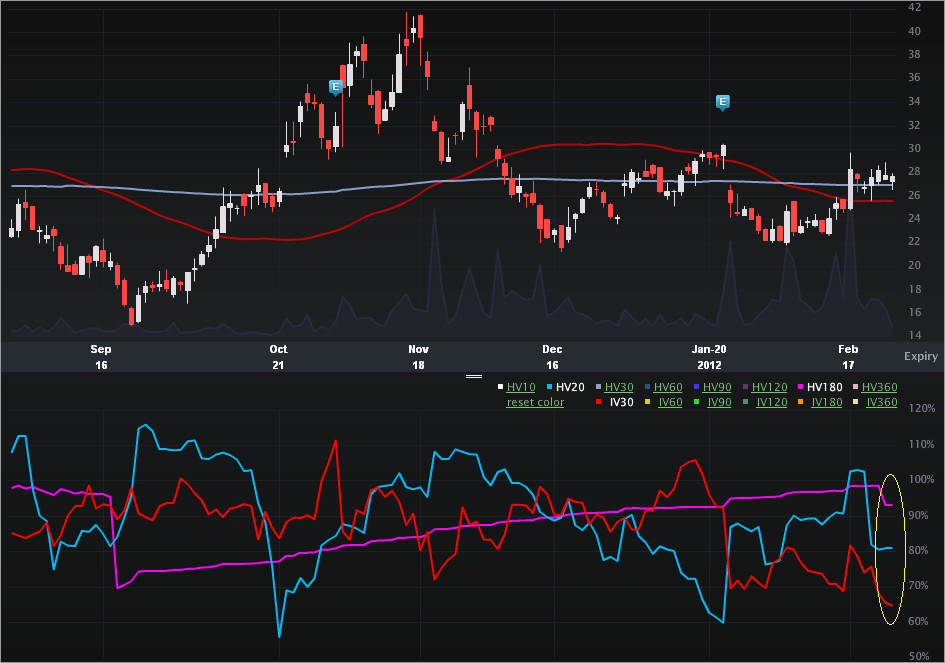
The FIO Charts Tab is included (below). The top portion is the stock price, the bottom is the vol (IV30™ - red vs HV20™ - blue vs HV180™ - pink).

On the stock side, we can see that this was a $41 stock in the not too distant past. There have been gaps up and down since Oct of last year, but recently the historical realized vol has found a bit of a quiet period. On the vol side we can see how depressed the implied has become relative to it’s own history, the short-term historical realized and the long-term historical realized vols Specifically:
We can see:
IV30™: 64.75%
HV20™: 80.99%
HV180™: 93.13%
The 52 wk range in IV30™ is [63.32%, 111.40%]. The level today puts it in the 2nd percentile (annual).

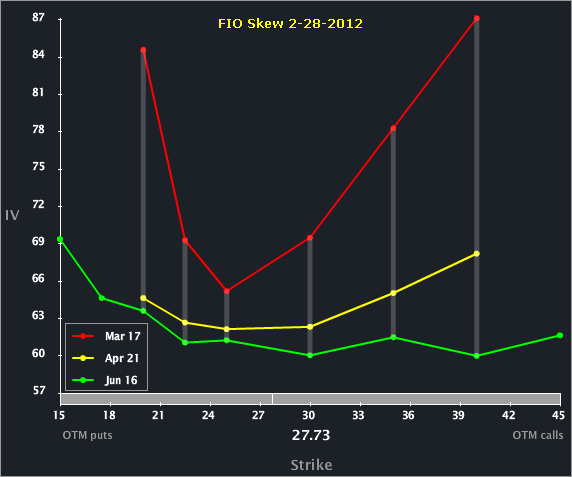
We can see a monotonic increase in vol from the back to the front. Both Mar and Apr have rising upside skew, which is the opposite of “normal” skew. The parabolic shape in Mar does create a rather large vol diff between the OTM calls and puts in that expiry relative to Apr and Jun.
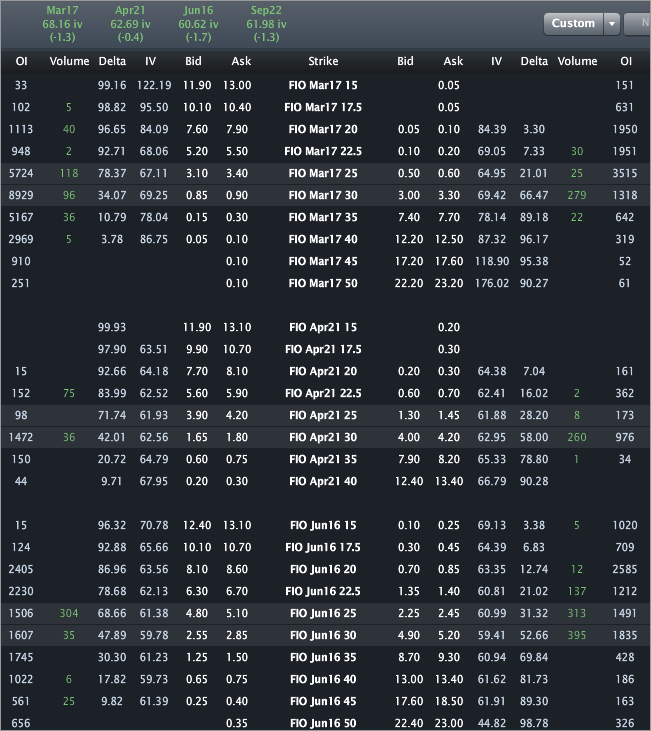
Finally, let's look to the Options Tab (below), for completeness.

I wrote about this one for TheStreet (OptionsProfits), so no specific trade analysis here. The monthly vols (across the top) are priced to 68%, 63% and 61%, respectively for Mar, Apr and Jun.
This is trade analysis, not a recommendation.
The goal with this scan is to identify short-term implied vol (IV30™) that is depressed both to the recent stock movement (HV20™) and the long term trend in stock movement (HV180™). I'm also looking for a reasonable amount of liquidity in the options (thus the minimum average option volume), want to avoid bio-techs (and their crazy vol) and make sure I'm not purchasing depressed IV30™ relative to HV20™ simply because of a large earnings move.
The FIO Charts Tab is included (below). The top portion is the stock price, the bottom is the vol (IV30™ - red vs HV20™ - blue vs HV180™ - pink).

On the stock side, we can see that this was a $41 stock in the not too distant past. There have been gaps up and down since Oct of last year, but recently the historical realized vol has found a bit of a quiet period. On the vol side we can see how depressed the implied has become relative to it’s own history, the short-term historical realized and the long-term historical realized vols Specifically:
We can see:
IV30™: 64.75%
HV20™: 80.99%
HV180™: 93.13%
The 52 wk range in IV30™ is [63.32%, 111.40%]. The level today puts it in the 2nd percentile (annual).
3rd party Ad. Not an offer or recommendation by Investing.com. See disclosure here or remove ads.
Let’s turn to the Skew Tab to examine line-by-line vols.
We can see a monotonic increase in vol from the back to the front. Both Mar and Apr have rising upside skew, which is the opposite of “normal” skew. The parabolic shape in Mar does create a rather large vol diff between the OTM calls and puts in that expiry relative to Apr and Jun.
Finally, let's look to the Options Tab (below), for completeness.

I wrote about this one for TheStreet (OptionsProfits), so no specific trade analysis here. The monthly vols (across the top) are priced to 68%, 63% and 61%, respectively for Mar, Apr and Jun.
This is trade analysis, not a recommendation.
Which stock should you buy in your very next trade?
With valuations skyrocketing in 2024, many investors are uneasy putting more money into stocks. Unsure where to invest next? Get access to our proven portfolios and discover high-potential opportunities.
In 2024 alone, ProPicks AI identified 2 stocks that surged over 150%, 4 additional stocks that leaped over 30%, and 3 more that climbed over 25%. That's an impressive track record.
With portfolios tailored for Dow stocks, S&P stocks, Tech stocks, and Mid Cap stocks, you can explore various wealth-building strategies.
