Key Points:
- Moving to form an ascending triangle
- Aggressively bullish EMA activity
- Parabolic SAR still reading bullish
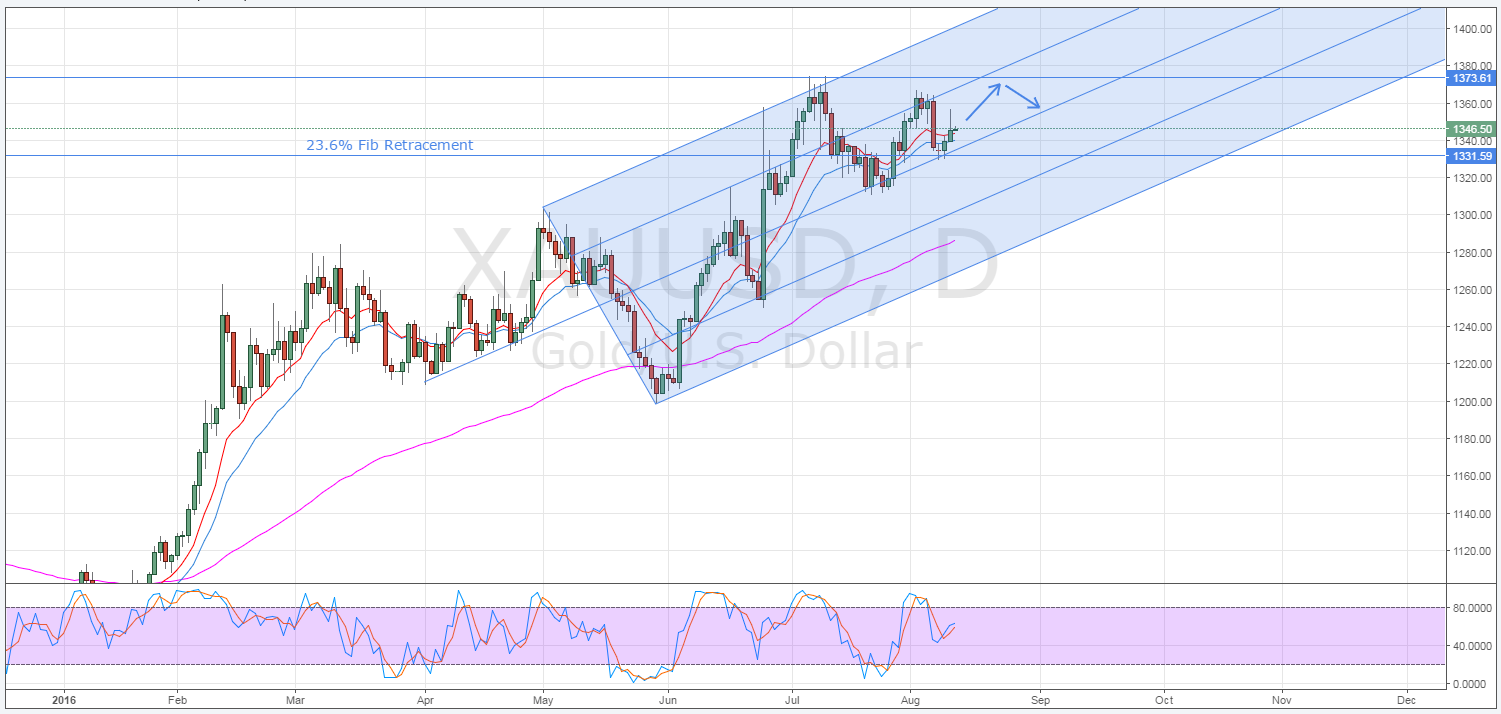
As gold continues to distance itself from its recent ranging phase, the metal has been encountering some stiff resistance around the 1373.61 level. However, as it consolidates higher,gold could finally generate the requisite momentum to see itself push through resistance once again. Specifically, the commodity should continue to follow the pitch fork higher and form an ascending triangle. Subsequently, any breakout is likely to be on the upside as a range of technicals are showing a bullish bias.
As shown below, gold began to rally at the end of June but it seems to have finally run out of steam as it extends towards the 1373.61 mark. However, rather than moving into a new ranging phase, as was seen after the last major price rally, the metal could instead be moving into a consolidation phase. Notably, the commodity has been experiencing a trend of higher lows which follow the daily pitchfork’s central tendency higher.

As a result of the higher lows and the robust zone of resistance, gold is beginning to look fairly set to form an ascending triangle pattern. This being said, further price action is required to confirm the nature of the consolidation structure as it could also result in a rising wedge or bullish pennant. Regardless, technical bias is still in favour of some continued bullishness which should cause the metal to test resistance.
Taking a closer look at some of the technical indicators, the most obvious signal with a bullish bias is the daily EMA activity. As shown above, the 100 day EMA remains aggressively upward sloping and the 12 and 20 day averages are also in a bullish configuration. In addition to this, daily and H4 Parabolic SAR readings are also strongly suggestive of an ongoing uptrend. Furthermore, the relative neutrality seen in the Stochastic oscillator means that there is little chance of the metal becoming overbought.
When combined, the technical evidence is highly suggestive that gold has some fuel left in the tank and could potentially not only move to challenge resistance, but even break through it over the coming week or so. Moreover, recent upticks in the VIX could continue to add some additional momentum to the price rally as market uncertainty grows more widespread.
Ultimately, gold’s consolidation phase will have to come to an end shortly. As a result of the current technical readings, there looks to be a good chance of the metal mustering the sentiment to see itself breaking out to the upside rather than the downside. However, keep an eye out for any surprises in the fundamental results as they are sure to impact the traditional safe haven strongly
