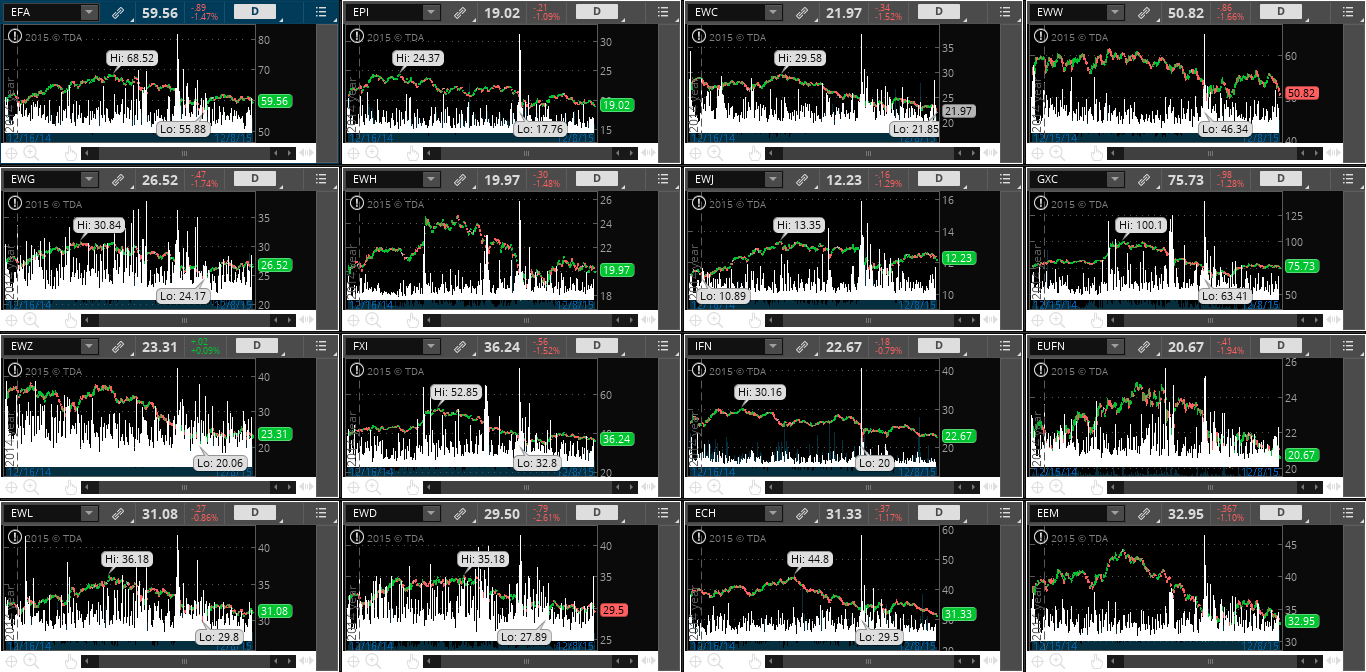
One gauge of market sentiment that I look at from time to time is my chartgrid of Foreign ETFs:
- iShares MSCI EAFE (N:EFA)
- WisdomTree India Earnings (N:EPI)
- iShares MSCI Canada (N:EWC)
- iShares MSCI Mexico Capped (N:EWW)
- iShares MSCI Germany (N:EWG)
- iShares MSCI Hong Kong (N:EWH)
- iShares MSCI Japan (N:EWJ)
- SPDR S&P China (N:GXC)
- iShares MSCI Brazil Capped (N:EWZ)
- iShares China Large-Cap (N:FXI)
- India Closed Fund (N:IFN)
- iShares MSCI Europe Financials (O:EUFN)
- iShares MSCI Switzerland Capped (N:EWL)
- iShares MSCI Sweden (N:EWD)
- iShares MSCI Chile Capped (N:ECH)
- iShares MSCI Emerging Markets (N:EEM)
It shows the daily ATR on each ETF (the white histogram at the bottom of each ETF)...an extremely high ATR can often signal capitulation and a reversal of recent general trend.
From the chartgrid below, we're not seeing that extreme, yet. In my opinion, we could very well see further downside on these ETFs, in general, for a while longer.

