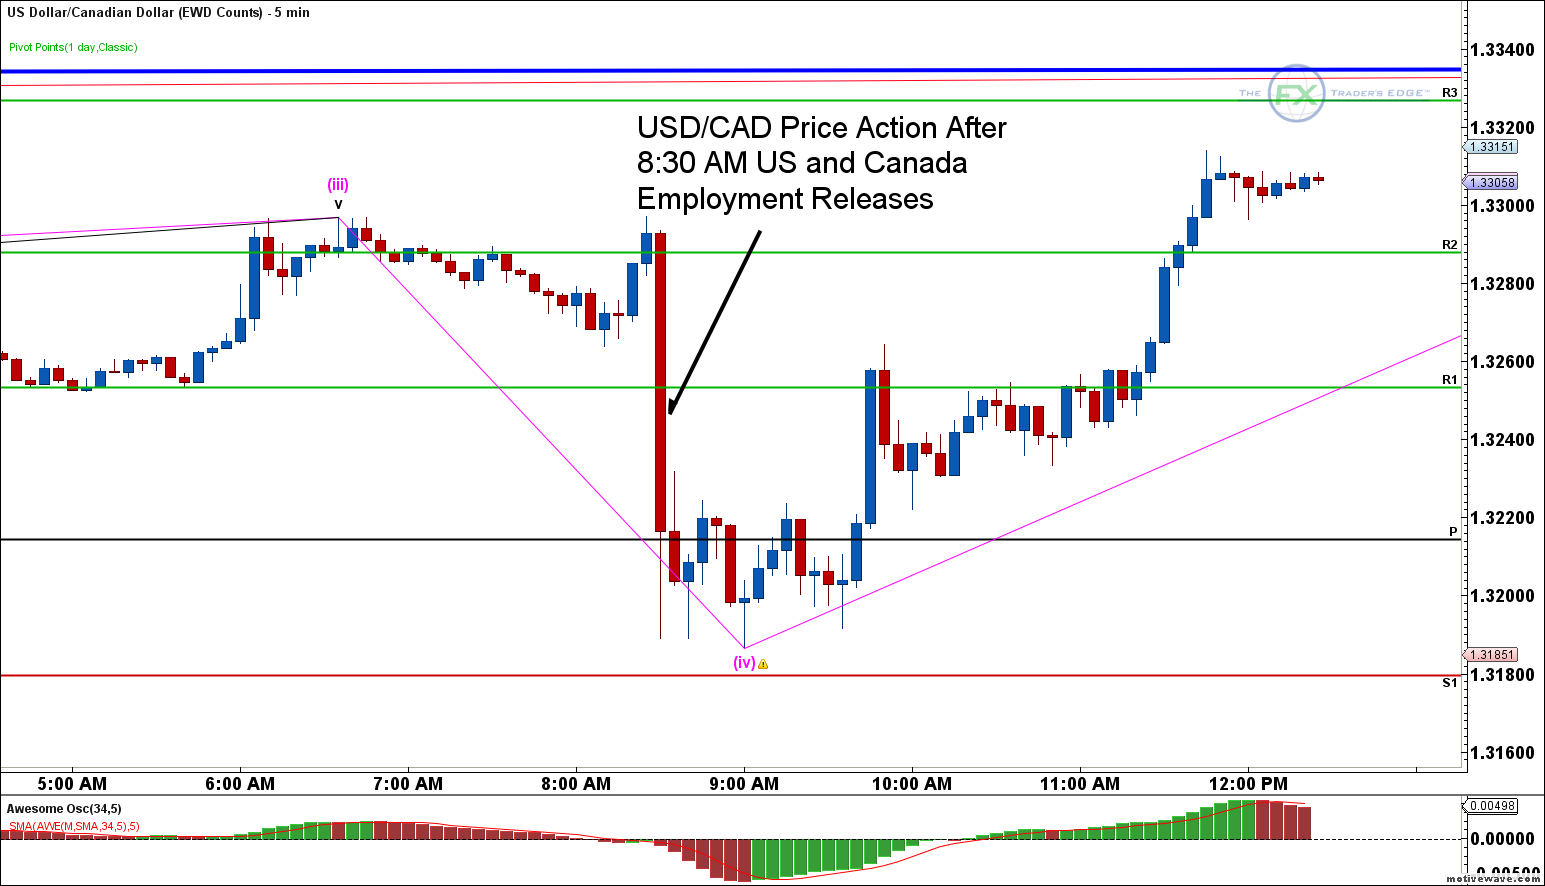
The USD/CAD is trading back at 1.33003 ½ hours after a one hundred pip drop from 1.3295 to 1.3190 on the US and Canada Employment data releases last Friday. From a daily pivot point perspective, the USD/CAD was sitting at R2 prior to the releases, traded down to almost S1, and back up again to above R2, which is quite a move in pivot country, providing good day trading opportunities off the release lows of 1.3190. (See 5-minute USD/CAD chart above)
Our Elliott Wave Desk wave count has been calling for a weaker CAD, but how far can we go before running into resistance? The question is how likely is the USD/CAD to continue to move higher from a wave count perspective, and what about looking at some of the crosses to support that view as well?
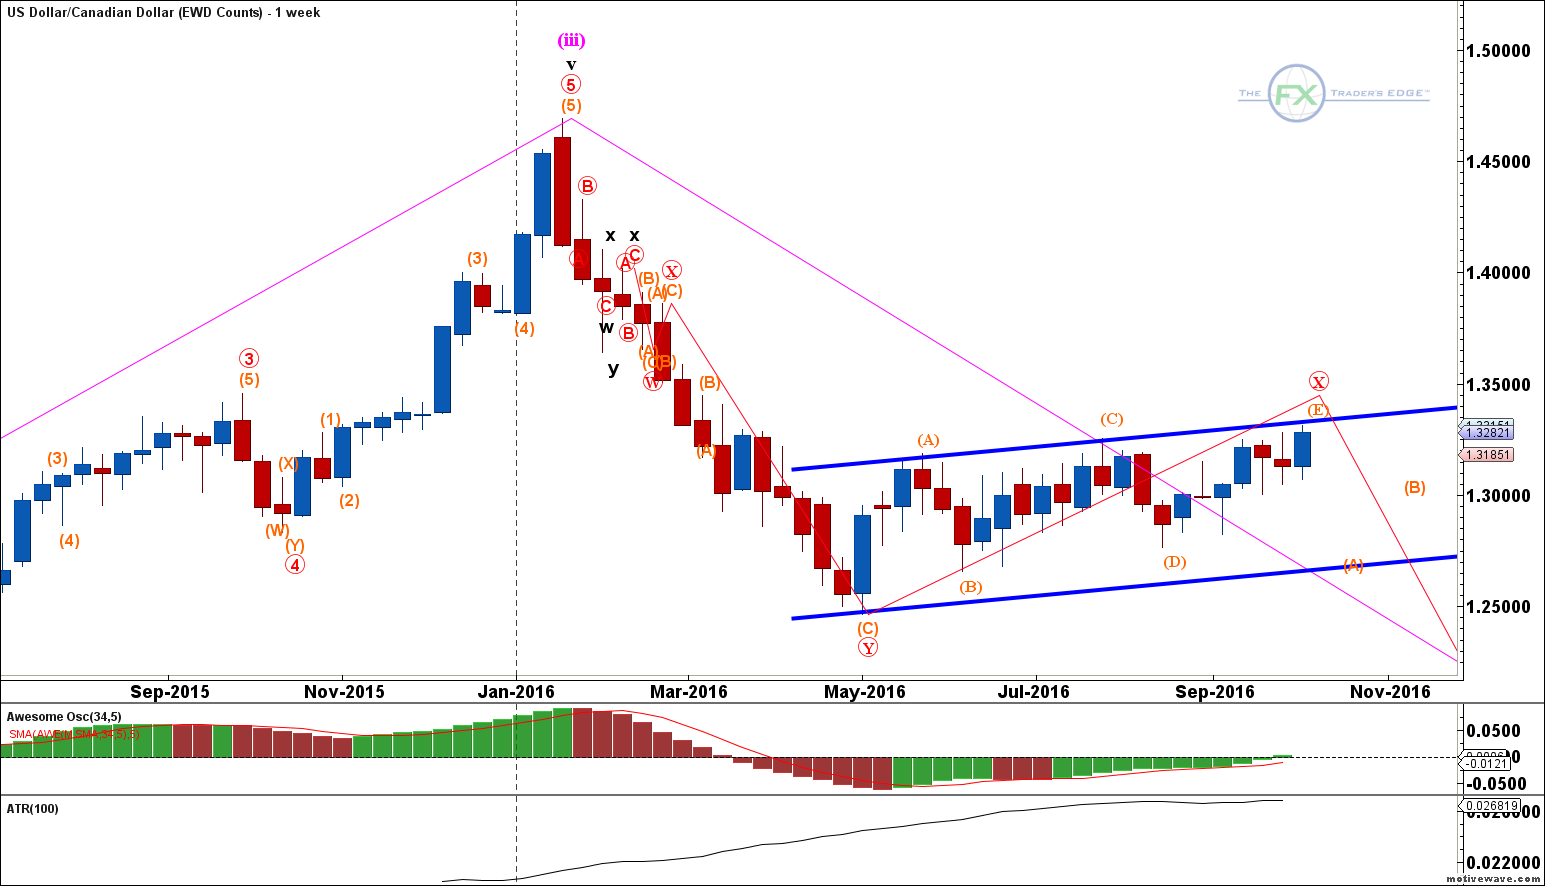
Looking at the weekly time frame, the USD/CAD is drawing out a nice upward sloping pattern which we are labeling as an ABCDE triangle. We are currently in the orange E leg which will complete red wave X once done. What that means is, the current swing move is still up and the initial target is the channel line and the 38.2% Fibonacci retracement of the prior swing move at 1.3313. We have met our target and although price could travel further, we are satisfied with this move and will begin to look for a confirmed reversal from these or slightly higher levels. See weekly chart below.

Moving over to the crosses, the daily charts of USD/CAD, CAD/JPY, AUD/CAD and EUR/CAD in the figure below, we look for strength and weakness within the channel lines, and also for a consistency in CAD strength or weakness. We have already established that USD/CAD is still in an uptrend (weaker CAD), even though it is at weekly channel resistance. The CAD/JPY has a nice daily bearish engulfing candle at daily channel resistance, which is a sell CAD/JPY trade. On the AUD/CAD chart, this pair has traded sideways in a corrective Elliott Wave pattern, which is likely a continuation pattern pointing to a stronger AUD/CAD cross. Finally, the EUR/CAD is trading bullish today in a sideways corrective pattern. All for pairs are closing the day with a bearish CAD bent.

Elliott Wave analysis provides the direction, the view and the context. It is up to you to use your strategy to confirm your trades. To follow our daily Elliott Wave analysis on 13 different markets, sign up for your trading buddy special pricing link.
For this week, I encourage you to test your skills with this Elliott Wave analysis while keeping your risk and emotions under control. Have a clear plan and trade your plan. We wish you success in your trading business.
