
On Wednesday at 1030GMT/ 0530 ET the Bank of England will deliver its first Inflation Report of the year. This quarterly report sets out the Bank’s detailed economic analysis and inflation projections, on which the MPC’s monetary policy decisions (interest rate decisions and asset purchases / QE) are based.
Thus, tomorrow’s report is important for a few reasons: 1, it may help to determine if the bank will embark on more QE after expanding asset purchases by GBP50 billion last week, and 2, whether the recent pick-up in growth will be reflected in an improvement in the Banks’ growth and inflation forecasts.
What was the Bank’s last prognosis?
In its November 2011 Report, the Bank’s analysis made for grim reading. It said that the prospects for the UK economy had worsened due to fiscal consolidation at home and stresses in the Eurozone. The Bank sounded concerned about growth, which had expanded well below its historical average in 2011. It expected a “near-term” slowdown in economic expansion, followed by a recovery in Q2 and Q3. However, it added that the “outlook for output growth is unusually uncertain”.
The Bank also expected inflation to fall sharply in 2012 due to the decline in VAT, energy and import price contributions to the price index along with downward pressure from slack in the labour market. The Bank acknowledged that there were a range of views about the out-turn for inflation within the Committee and again that the outlook was uncertain. However, it said that on balance the Committee felt inflation was likely to be below the 2% target in the coming 2 years than above it.
So what could this report hold?
The latest inflation data from January showed a sharp decline in both the headline CPI rate and the RPI rate. The RPI rate fell to its lowest level since August 2010, while the CPI rate has fallen by 1.6% since peaking at 5.2% in September 2011. This decline has been due to VAT falling out of the index and the declining cost of commodities including food, alcohol and tobacco products. Thus, inflation looks like it is following the Bank’s projected path in its November Report and tomorrow we expect inflation estimates to continue to point to an under-shoot in the inflation target next year.
However, the one area that differs from the Bank’s prior projections is growth. The “recovery” in growth has been much quicker than expected. The PMI manufacturing survey was stronger than expected, along with the services survey, which reached its highest level in nearly a year. Industrial production and trade data also picked up at the end of 20111.
Although the Bank expected the decline in output to be temporary, the better tone to the economic data in recent weeks may be enough for the Bank to bring forward its recovery period to the first quarter of this year and tomorrow we may see some upward revisions to its projection for growth.
However, the big problem is unemployment. The latest jobless rate is released tomorrow also and it is expected to show that the unemployment rate will remain at a lofty 8.4%, the highest level since 1995. Added to that, an extra 3,000 people are expected to have claimed unemployment benefit in January. Combined with fiscal tightening (the bulk of public sector spending cuts are expected in the next 2 parliamentary years) along with continued risks from the Eurozone and the Bank may want to urge on the side of caution.
To QE or not to QE?
Last week the pound and Gilt yields rose when the Bank announced its latest increase in asset purchases. That may have been because the Bank “only” pledged to buy another GBP 50 billion, below some expectations of GBP 75 billion. So because the Bank scaled back on its asset purchases there won’t be any more, right? No.
In its first round of QE back in 2009 the Bank bought GBP200bn of assets at GBP50 billion clips and then finished it off with a GBP25 billion pledge at the end of October 2009. So GBP 50 billion tends to be the standard amount of purchases for the Bank, and the October 2011 GBP 75bn of increase to the asset purchase target was the anomaly. Back then financial markets were in a tizzy about a meltdown of the Eurozone as the sovereign debt crisis spiralled out of control, now that things have stabilized post the ECB’s LTRO programme the Bank can go back to the smaller increments it is used to.
We believe the Bank will err on the side of caution and point to more QE in its report tomorrow. The Bank could extend purchases to GBP 400bn by the end of this year due to fears over the outlook for inflation and the unemployment rate. At this juncture the outlook is too uncertain for the Bank to call an end to its QE programme. Of course, if growth picks up or the unemployment rate starts to reverse then the Bank could end QE early, but that is further down the line in our opinion.
Added to that, even if growth picks up and inflation doesn’t fall back as much as expected the Bank has shown a preference for inflation over-shooting the target rather than under-shooting it, so a pick-up in growth and thus moderate inflationary pressure may not be enough to cause the Bank to ditch QE altogether.
But what does this mean for the pound?
With the prospect of more QE still on the table in the US, the Eurozone doing QE by the back door and the Bank of Japan also joining the party the race to the bottom is on for the major currencies of the world. The pound is looking weak versus the dollar; however, EURGBP has failed to recover after last year’s sell -off. GBP/JPY is also starting to look interesting post the BOJ QE announcement and the recent re-bound in USD/JPY.
GBP/USD: this pair tends to be fairly immune to BOE action and QE, and is more sensitive to the overall risk environment and movements in the S&P 500. It has weakened this week along with overall risk appetite. A bearish engulfing candlestick pattern last week marked the top just below 1.5950. It has fallen sharply since then and is approaching key 21 day and 100 - day ema support at 1.5680. Below here opens the way to 1.5600. 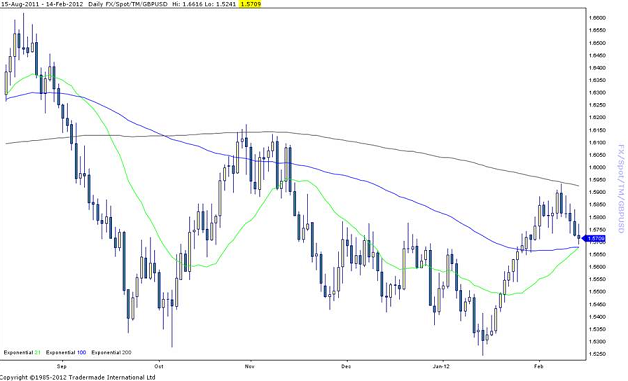 GBP/USD" title="GBP/USD" width="628" height="381">
GBP/USD and SPX 500 – the pound has showed more sensitivity to the S&P 500 than to announcements of more QE from the BOE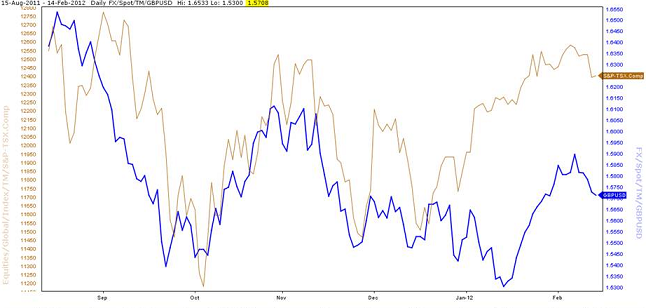 GBP/USD and SPX 500" title="GBP/USD and SPX 500" width="646" height="308">GBP/JPY: We have seen a bullish engulfing candle pattern on the daily GBPJPY chart, which is a bullish sign and suggests there may be some further upside for this pair. The next key level to watch is the 123.33 – the 61.8% retracement of the August 2011 high to the October 2011 low. This could act as key resistance. A lot of the future direction of this pair will depend on USDJPY; if it gets thwarted above 78.090 then we could see choppiness persist in other JPY crosses. But right now, the pound seems to be more immune to QE than the yen, which is GBP/JPY positive.
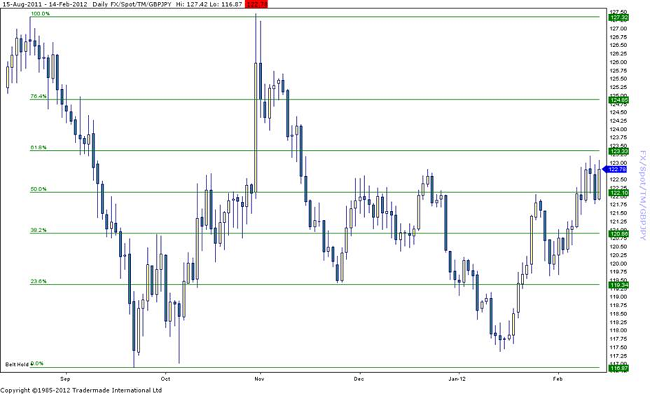 GBP/JPY:" title="GBP/JPY:" width="650" height="394">
- English (UK)
- English (India)
- English (Canada)
- English (Australia)
- English (South Africa)
- English (Philippines)
- English (Nigeria)
- Deutsch
- Español (España)
- Español (México)
- Français
- Italiano
- Nederlands
- Português (Portugal)
- Polski
- Português (Brasil)
- Русский
- Türkçe
- العربية
- Ελληνικά
- Svenska
- Suomi
- עברית
- 日本語
- 한국어
- 简体中文
- 繁體中文
- Bahasa Indonesia
- Bahasa Melayu
- ไทย
- Tiếng Việt
- हिंदी
Fundamental Update: What to Expect in the UK’s Inflation Report
Published 02/14/2012, 10:20 AM
Updated 05/18/2020, 08:00 AM
Fundamental Update: What to Expect in the UK’s Inflation Report
Latest comments
Loading next article…
Install Our App
Risk Disclosure: Trading in financial instruments and/or cryptocurrencies involves high risks including the risk of losing some, or all, of your investment amount, and may not be suitable for all investors. Prices of cryptocurrencies are extremely volatile and may be affected by external factors such as financial, regulatory or political events. Trading on margin increases the financial risks.
Before deciding to trade in financial instrument or cryptocurrencies you should be fully informed of the risks and costs associated with trading the financial markets, carefully consider your investment objectives, level of experience, and risk appetite, and seek professional advice where needed.
Fusion Media would like to remind you that the data contained in this website is not necessarily real-time nor accurate. The data and prices on the website are not necessarily provided by any market or exchange, but may be provided by market makers, and so prices may not be accurate and may differ from the actual price at any given market, meaning prices are indicative and not appropriate for trading purposes. Fusion Media and any provider of the data contained in this website will not accept liability for any loss or damage as a result of your trading, or your reliance on the information contained within this website.
It is prohibited to use, store, reproduce, display, modify, transmit or distribute the data contained in this website without the explicit prior written permission of Fusion Media and/or the data provider. All intellectual property rights are reserved by the providers and/or the exchange providing the data contained in this website.
Fusion Media may be compensated by the advertisers that appear on the website, based on your interaction with the advertisements or advertisers.
© 2007-2025 - Fusion Media Limited. All Rights Reserved.