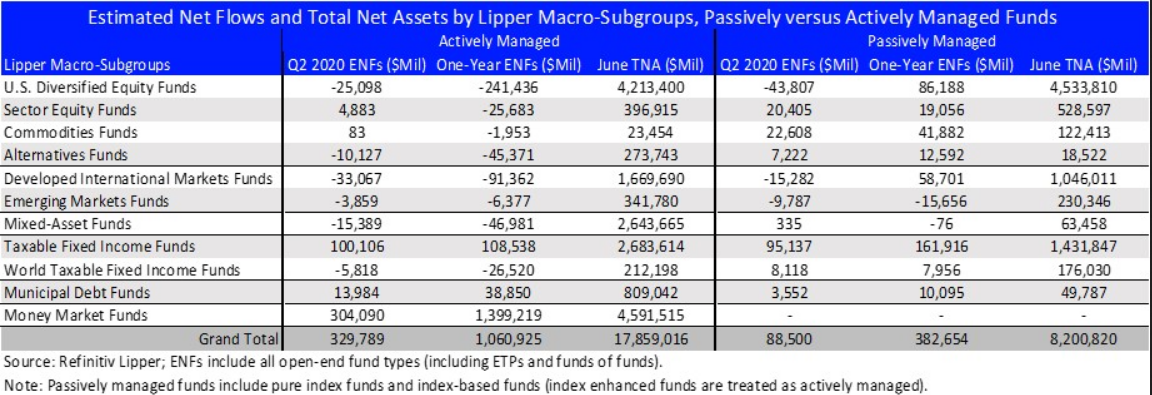
For the second quarter of 2020, investors were net purchasers of conventional mutual funds and ETFs, injecting $418.3 billion. However, just a little less than three-quarters of those assets went into money market funds (+$304 billion) as investors ducked for cover after the Q1 coronavirus-related market meltdown and following the economic shutdown and related uncertainty. The average equity and taxable bond funds (including ETFs) declined 22.33% and 4.56%, respectively, at the end of Q1.
Markets regained some ground as central banks around the world pulled out all the stops, providing unprecedented global fiscal and monetary stimulus—committing to do whatever it takes to get the global economy on a track to recovery—and businesses around the world began to slowly reopen, providing investors with some semblance of normalcy. Despite economic warnings from Federal Reserve Board and the U.S. Treasury and the World Health Organization stating that COVID-19 had entered “a new and dangerous phase” late in June, the average equity fund returned an eyepopping 20.22% (the group’s strongest quarterly return since Q4 1999) in Q2, but remained down 7.90% year to date. Meanwhile, the average fixed-income fund returned 5.45% and was up 0.40% year to date.
With the Fed shoring up its role as the lender of last resort, providing needed liquidity for commercial paper markets, corporate bond markets, and money market mutual funds, it was not surprising to see fund and ETF investors gravitate toward the perceived safety of fixed income securities in Q2 and into July. For the quarter, investors injected a net $197.5 billion into taxable bond funds (including ETFs) and $17.5 billion into municipal debt funds, with an almost even split of those assets going into actively managed taxable bond funds (+$94.3 billion) and passively managed taxable bond funds (+$103.3 billion). However, it appears that investors still prefer actively managed municipal bond funds (+$14.0 billion) over their passively managed brethren (+$3.6 billion).

However, on the equity side of the arena, investors were net redeemers of conventional equity funds and ETFs, withdrawing a net $100.9 billion. While both actively managed equity (-$82.6 billion) and passively managed equity (-$18.3 billion) funds suffered net redemptions, investors appeared to favor passive equity funds. For clarity, in this active versus passive review, passively managed funds include traditional ETFs (not actively managed ETFs, of which several have made their debut over the last couple of years) and pure and index-based mutual funds.
Actively managed domestic equity (-$30.3 billion), world equity (-$36.9 billion), and mixed-assets funds (-$15.4 billion) were shunned by investors, while their passively managed domestic equity (+$6.4 billion), world equity (-$25.1 billion), and mixed-assets fund (+$335 million) counterparts were generally viewed as more favorable investments.
While contrary to some beliefs, actively managed funds ($13.3 trillion, excluding money market funds) still make up 62% of all the long-term assets under management in the U.S. fund business. Passively managed funds (+$8.2 trillion) comprise the remaining 38%. However, for the fourth consecutive quarter, passively managed domestic equity funds’ assets under management (+$5.2 trillion) have surpassed those of actively managed domestic equity funds (+$4.9 trillion) as investors appear to favor passively managed U.S. diversified equity funds, sector equity funds, and commodities funds over their actively managed counterparts (three of the four macro subgroups making up the domestic equity macro-group).

