The FTSE 100 may have recovered 3.6% from its low, but the technical landscape suggests its Santa’s rally could be headed to the Grinch’s lodge for Christmas.
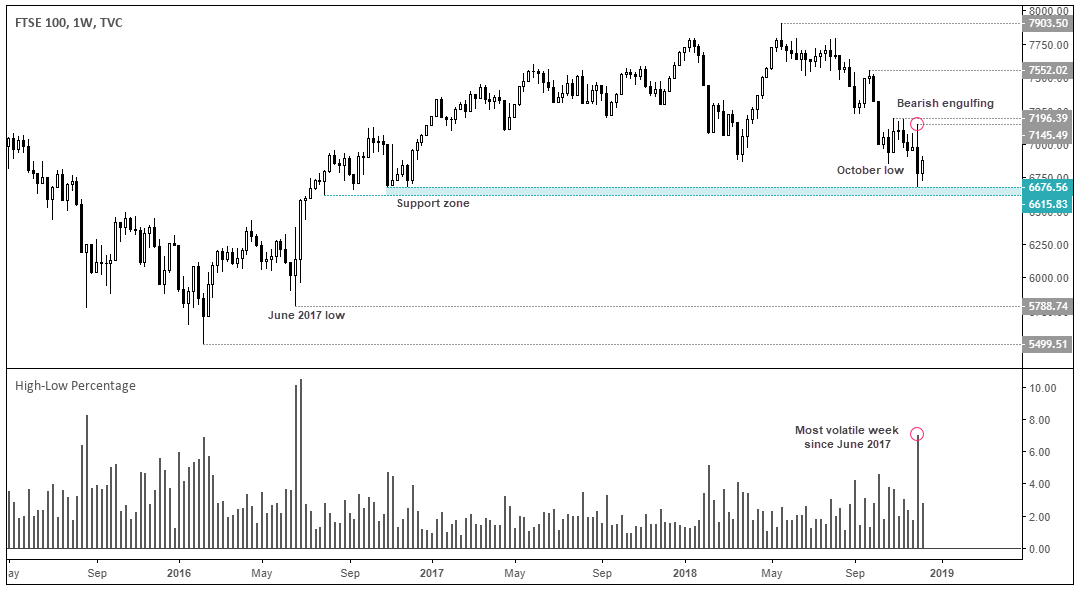
We can see on the weekly chart that a bearish engulfing candle marked its most volatile range since June 2017 and spanned a whopping 7%. Closing comfortably beneath October’s low, we think the bearish trend is set to resume. Moreover, if it can break beneath the 6615.83-6676.56 support zone there is very little in the way of obstacles until the June 2017 low at 5788.74. Even so, a short opportunity could be developing on the daily chart above this key support level.

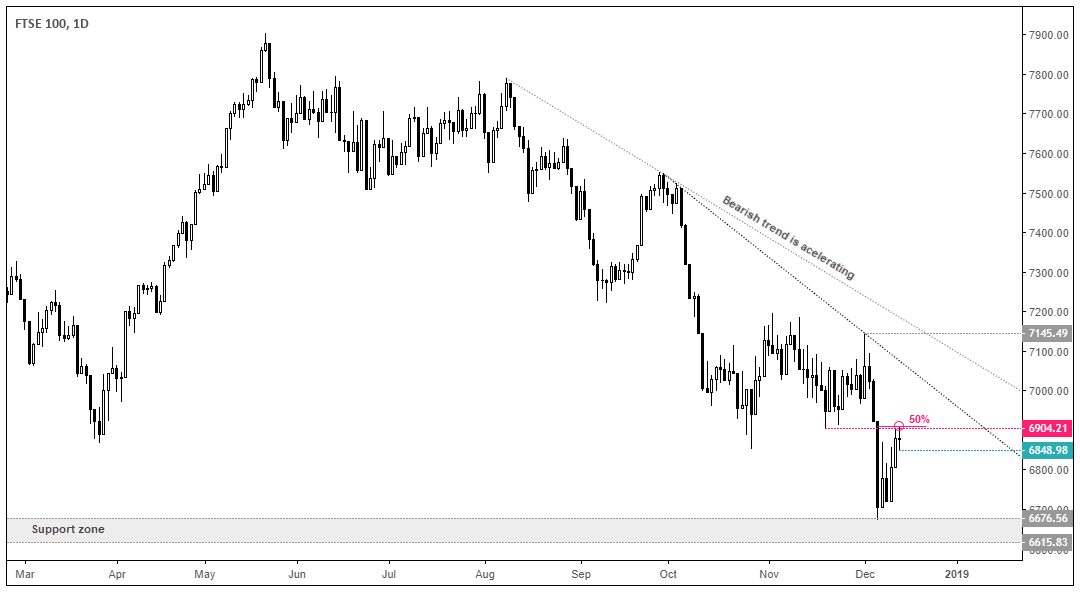
Switching to the daily chart shows the trend structure remains firmly bearish and its downside trajectory is increasing. Since retracing from 6676.56, a Rikshaw Man Doji has formed to show a hesitancy to break above a tight resistance cluster comprising of the 50% retracement level and 6904.21 low, suggesting its correction could be nearing an end.

Today’s price action is key for its next move over the near-term. A break above yesterday’s high warns of a deeper correction against the dominant trend and rekindles hopes of a Santa's rally. Whilst a break beneath 6848.98 brings the November low into focus, leaving a potential 172 points for bears on the table. And, as the trend assumes a break to new lows, there could be plenty more opportunity for bears to short if it breaks below 6615.83.
Whilst an upside break warns of a deeper correction, the trend remains bearish beneath 7145.49 and the bearish trendline provides another area to seek signs of weakness for an eventual move lower.
