FTSE: The Long And Short Of It: EasyJet, Compass, Hiscox

Published 11/26/2019, 01:26 AM
UK100
-
NXT
-
EZJ
-
EMG
-
VSVS
-
CPG
-
HSX
-
GRG
-
UTG
-
FTSE Sector Performance

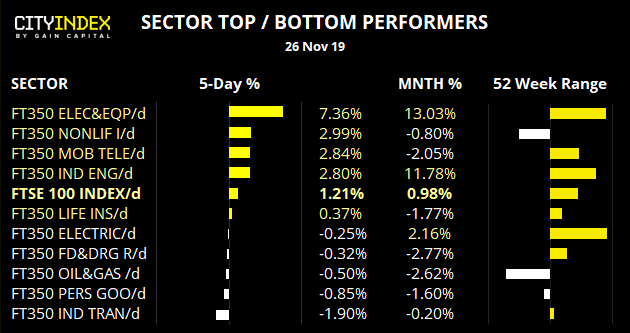
  • The FTSE 100 trades just shy of 7440 resistance, although yesterday’s relatively small range and tall upper wick shows a hesitancy to break higher. As it currently trades around levels which triggered a -5% and -3.2% decline since October, it would be prudent to expect at least a minor pullback.
  • The electronic and electrical equipment sector trades just below multi-year highs and has been the strongest performer these past 5 sessions. Oxford instruments is the strongest performer this year and shows potential for a bull flag. Yet we’d prefer a little mean reversion before jumping in at the highs.
  • The Oil & Gas sector remains ‘at the bottom of the barrel’ so to speak, being the weakest performer this past year. Tullow oil is on our radar but, similar to Oxford Instruments, needs a pullback of sorts before making it onto the watchlist.
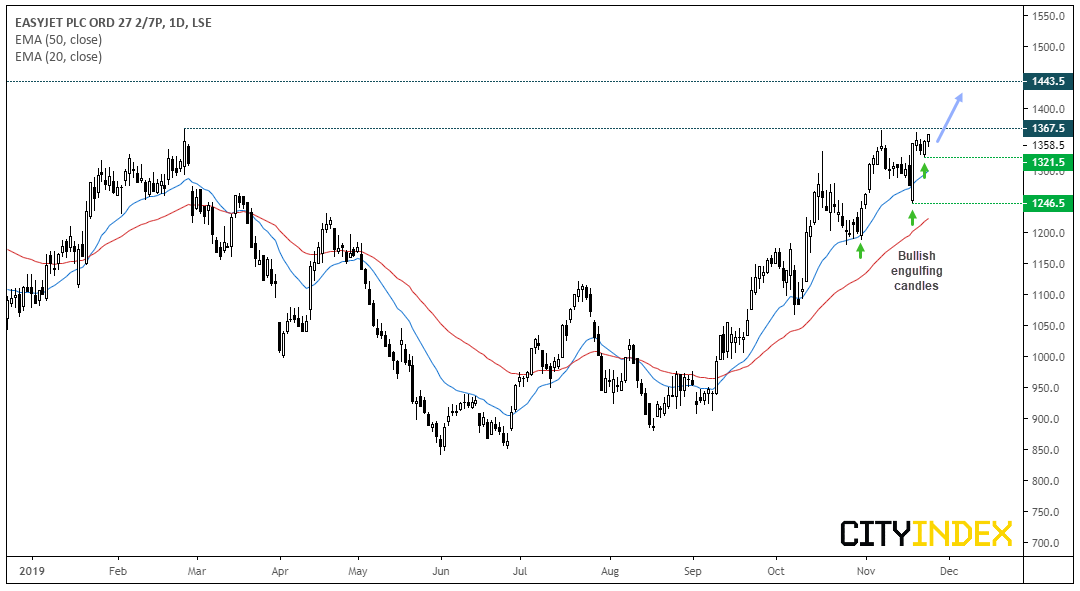
  • EasyJet PLC Daily Chart

    EasyJet CFD/DFT (LON:EZJ): A strong bullish trend has been developing with a timely series of higher lows. A bullish engulfing candle marks a prominent swing low at 1246.50, and the 20-day eMA is providing dynamic support. Prices are now consolidating beneath key resistance at 1367.50 and we’re watching to see if prices break higher.
  • Bulls could look for a break above 1367.50 or wait for a daily close confirmation above this level. Alternatively, they could watch to see if this level holds as support and enter during a consolidation period.
  • A smaller bullish engulfing candle places near-term support at 1321.50 and could aid with risk management, although the daily trend remains bullish above 1246.50.
  • Whilst the initial target is 1443.50, there may also be resistance around 1400 with it being a round number.
  • Compass Group PLC Daily Chart

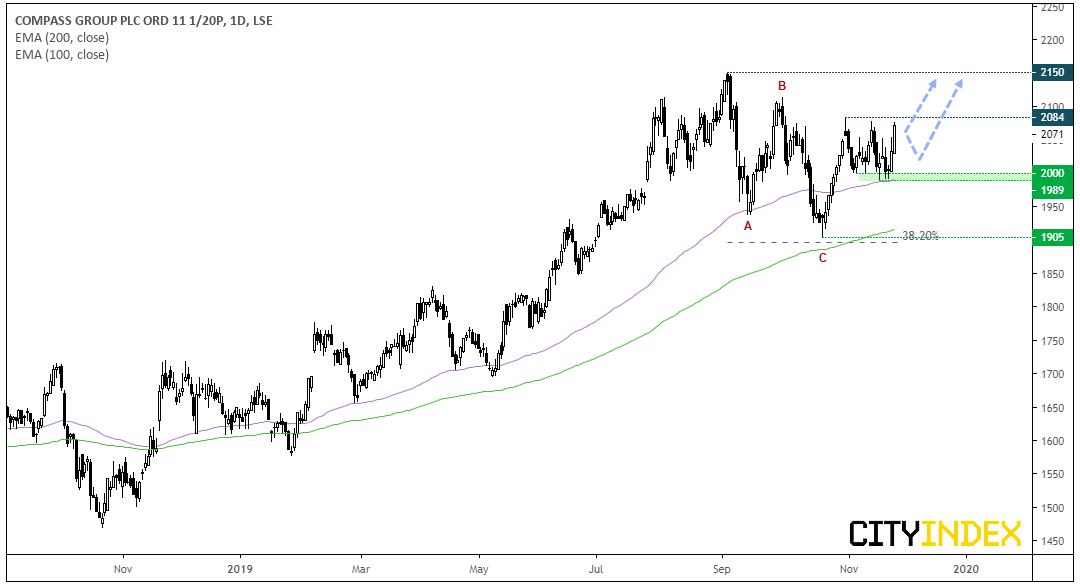
    Compass Group CFD/DFT (LON:CPG): An ABC corrective pattern appears to have competed around 1900. Stopping just shy of the 38.2% Fibonacci ratio and 200-day eMA, momentum now realigning with the longer-term, bullish trend. A new range is being carved out between 2000 – 2084 and prices have rebounded from the 100-day eMA.
  • Bulls could wait for a break above 2084 and target the 2150 high initially. Yet we’re also looking for it to break to new highs, given the strength of the bullish trend this past year.
  • If resistance holds, another approach is to enter on dips whilst the 1989-2000 support zone holds in anticipation of a bullish breakout.
  • The near-term bullish bias is invalidated with a break below 1989.
  • Hiscox Ltd Daily Chart

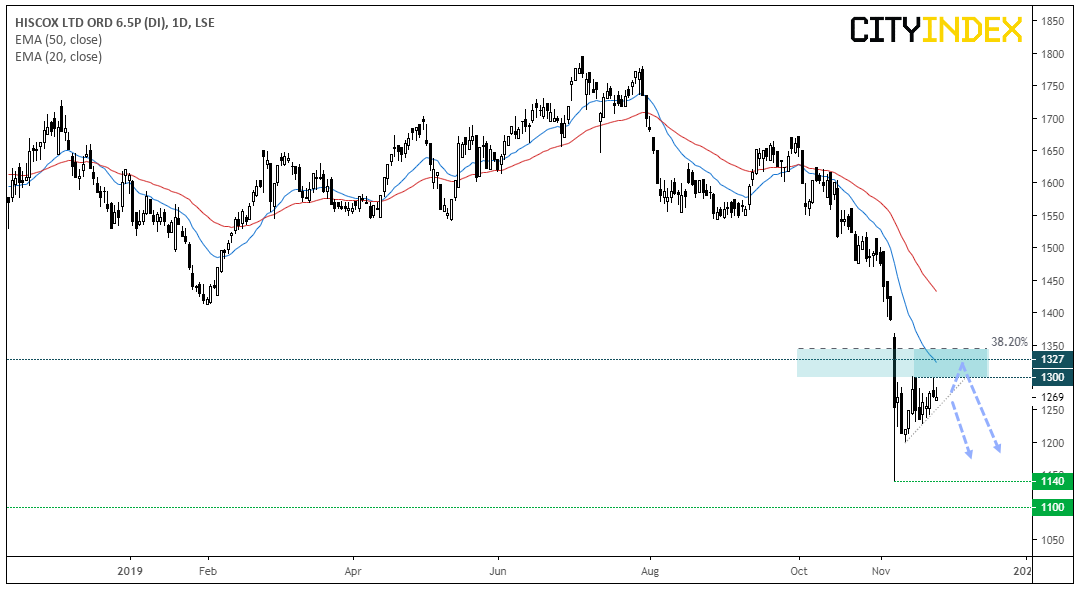
    Hiscox Ltd (LON:HSX) CFD/DFT: Arguably a little premature following such a large drop, but prices are consolidating within a potential dead cat bounce pattern. A dark cloud cover reversal and bearish hammer have formed to show resistance at 1300 although we’d continue to monitor for a potential short whilst prices consolidate beneath 1350 (near the 38.2% Fibonacci levels).

  • Bears could wait for range expansion to break beneath the corrective trendline. Alternatively, fade into minor rallies beneath 1350 to assume another leg lower.
  • Initial target is the 1140 low.
  • Price Action Update

    Next PLC (LON:NXT) CFD/DFT: After breaking out and retesting the corrective channel, prices have rallied and stopped just shy of the record highs. From here, we’d either want to see prices consolidate ahead of a breakout, or if it trades directly higher, enter after a period of consolidation.

    Vesuvius PLC (LON:VSVS) CFD/DFT: This is still on the short watchlist as it didn’t break support around 408. However, it’s pulled back to its long-term bearish trendline and the 61.8% resistance level. Still, if bearish momentum returns then we’d still prefer short opportunities, whereas a break above 444 removes it from the watchlist.

    Unite Group PLC (LON:UTG) CFD/DFT: Initial target achieved and exceeded. After breaking to record highs, price retraced and confirmed support around 1180. Near-term bias remains bullish above 1180 and bearish below. Given the strength of the underlying trend, we’d continue to monitor for potential longs whilst prices hold above 1100.

    Man Group PLC (LON:EMG) CFD/DFT: 140 proved too strong a level to break and a momentum shift has occurred at the lows. With near-term momentum favouring the bulls, this has been removed from the watchlist.

    Greggs PLC (LON:GRG) CFD/DFT: Ultimately, we’re waiting for a break above key resistance at 2146 but have noted that a potential bull flag is now forming above 2000. If bearish momentum takes it below the 1950-2000 area it will be removed from the watchlist.

    Original Post

    Latest comments

    Loading next article…
    Risk Disclosure: Trading in financial instruments and/or cryptocurrencies involves high risks including the risk of losing some, or all, of your investment amount, and may not be suitable for all investors. Prices of cryptocurrencies are extremely volatile and may be affected by external factors such as financial, regulatory or political events. Trading on margin increases the financial risks.
    Before deciding to trade in financial instrument or cryptocurrencies you should be fully informed of the risks and costs associated with trading the financial markets, carefully consider your investment objectives, level of experience, and risk appetite, and seek professional advice where needed.
    Fusion Media would like to remind you that the data contained in this website is not necessarily real-time nor accurate. The data and prices on the website are not necessarily provided by any market or exchange, but may be provided by market makers, and so prices may not be accurate and may differ from the actual price at any given market, meaning prices are indicative and not appropriate for trading purposes. Fusion Media and any provider of the data contained in this website will not accept liability for any loss or damage as a result of your trading, or your reliance on the information contained within this website.
    It is prohibited to use, store, reproduce, display, modify, transmit or distribute the data contained in this website without the explicit prior written permission of Fusion Media and/or the data provider. All intellectual property rights are reserved by the providers and/or the exchange providing the data contained in this website.
    Fusion Media may be compensated by the advertisers that appear on the website, based on your interaction with the advertisements or advertisers.
    © 2007-2025 - Fusion Media Limited. All Rights Reserved.