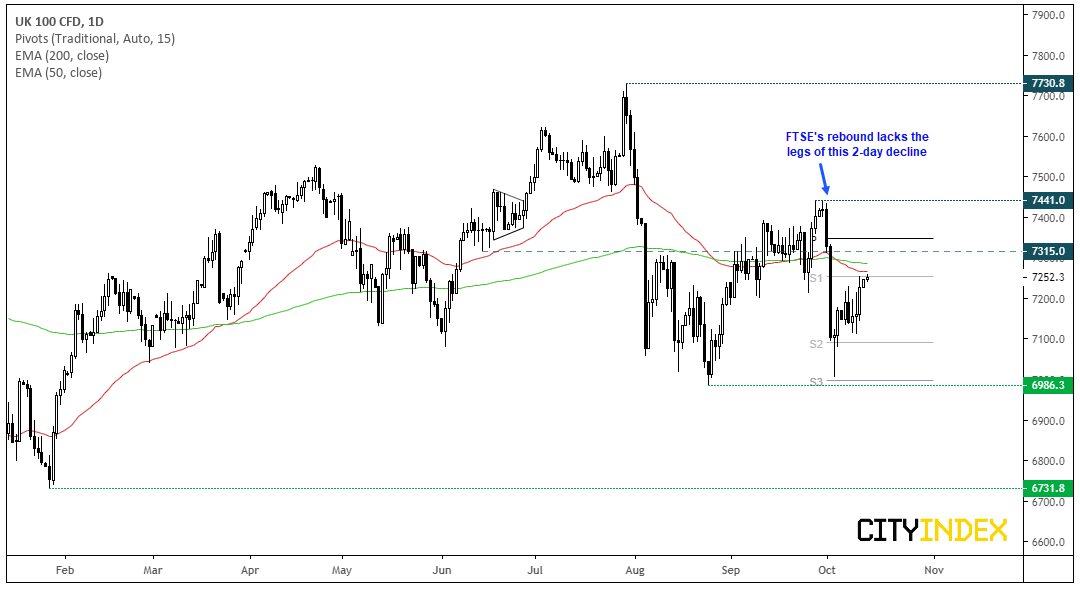
The FTSE 100 continues to ricochet between key levels, yet lacks the compelling trend structure required to easily decipher if it will break higher or roll over once more. Sure, it’s seen a nice bounce from the 7,000 lows yet it has taken 8 sessions to recoup half the losses sustained over just two. Therefor, we’d lean towards FTSE topping out although with sentiment supportive of equity markets, not confident enough to say the high is in place. Still, given its rebound remains minor compared with its peers, it could just take for the trade boost sentiment to waver and perhaps we’ll have a better reason to call a top. For now, prices have found resistance around the 50 and 200-day eMA’s and monthly S1 (an area which might temp some bears to fade into), so we’ll continue to monitor for a potential high.

Below are some FTSE stocks which warrant a closer look, along with an update of price action of previously highlighted FTSE stocks.
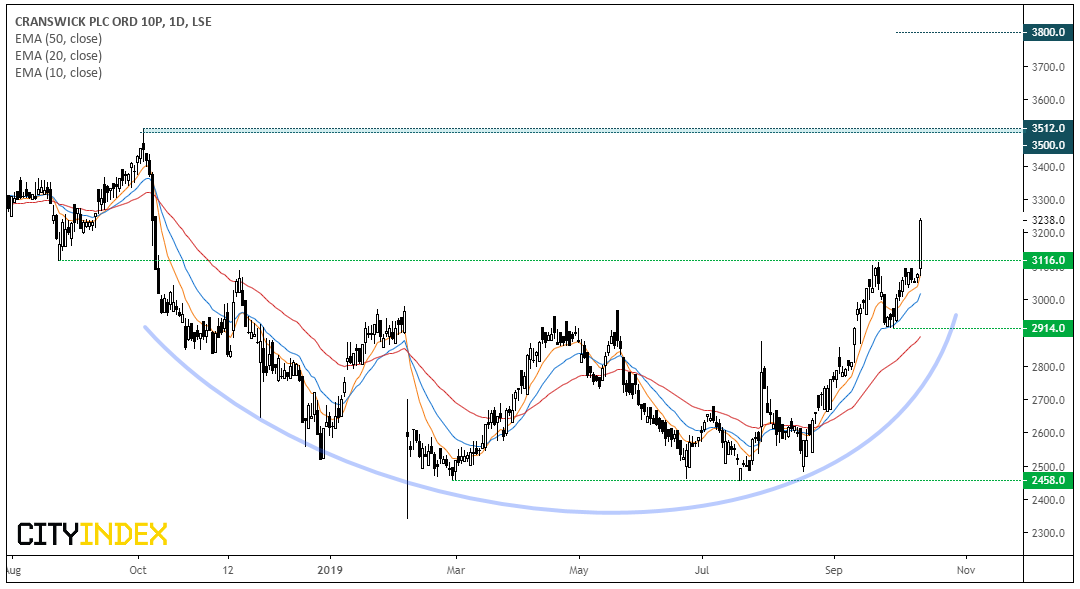
Cranswick Plc (CWK.L): Friday’s range expansion saw Cranswick break out of a 1-year basing pattern (rounding bottom). Volume on Friday was above it 20-day average to suggest the breakout carries some weight, and we like how a strong bullish structure has developed since the August low. The 10 and 20-day eMA’s are also acting as dynamic support and pointing higher.

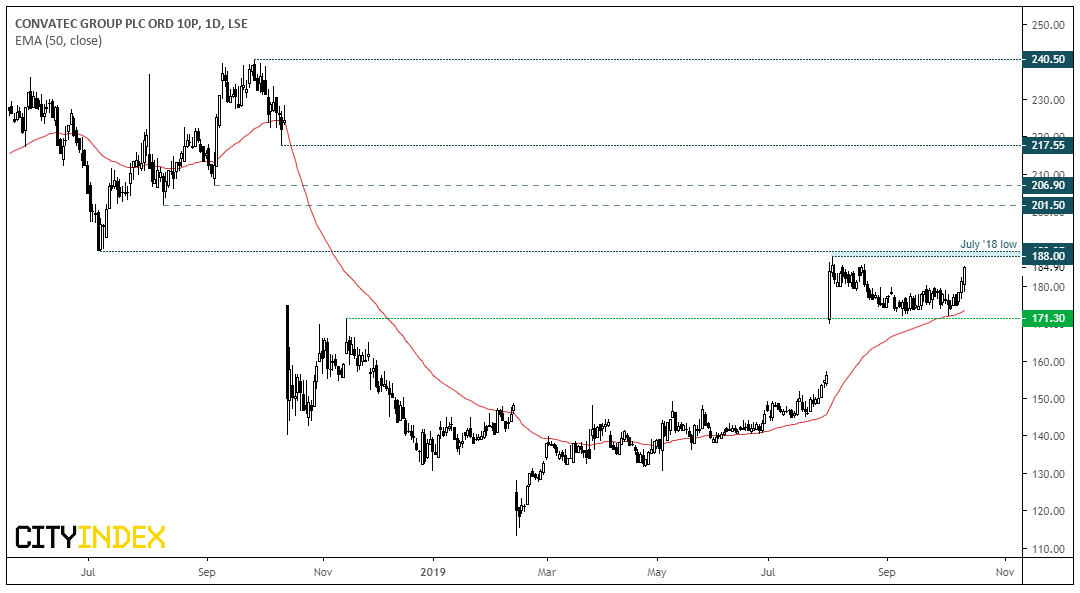
Convatec Group (CTEC.L): It’s certainly not a top performer this year, but things may be starting to pick up for a technically bullish case. Since gapping higher in August, Prices consolidated and pulled back from the July 2018 before finding support at the 50-day eMA. Bullish momentum is now returning and appears set to have a crack at breaking to new highs.

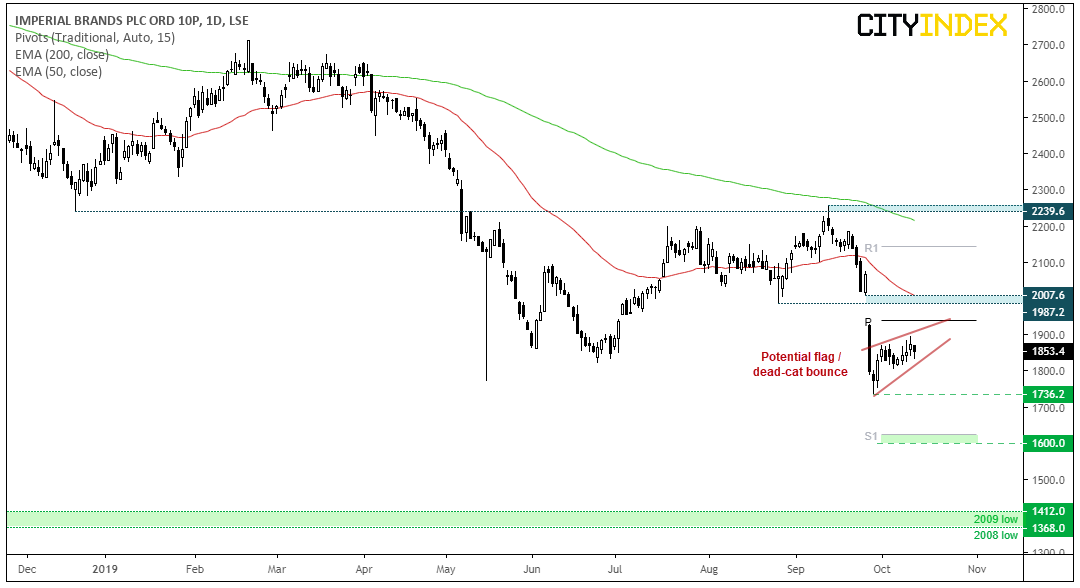
Imperial Brands Plc (LON:IMB.L): The monthly chart produced a bearish engulfing month in September, which itself is part of a 3-month bearish reversal pattern (evening star). Furthermore, the highs of the pattern have respected the 200-month average as resistance, so we suspect a major high is in place.
Price Action Update: FTSE Looks For A Leg-Up | SGRO, AVV, JD:
JD Sports: The breakout from the bullish flag has held up, although we’ve seen a few oscillations at the highs. Still, the trend structure remains overwhelmingly bullish and is still the top performer in the FTSE 100. Closing to a new record high, we remain bullish above the 717 low.
AVEVA Group: This one is still waiting for a breakout, although the bearish channel has come under threat. However, a series of higher lows has formed to suggest bullish pressure is building, so we’d still consider a bullish setup if it can break above 3,800. Given the longer-term trend is bullish, this was always the preferred setup from a reward to risk perspective.
Segro Plc: Since the breakout, prices formed a small triangle/bullish pennant ahead of Friday’s explosion higher. We’d like to see some more consolidation before reconsidering another entry, although we can raise the ‘invalidation’ point to the 780.6 swing low (previously 759.8) with the break to a new cycle high.
