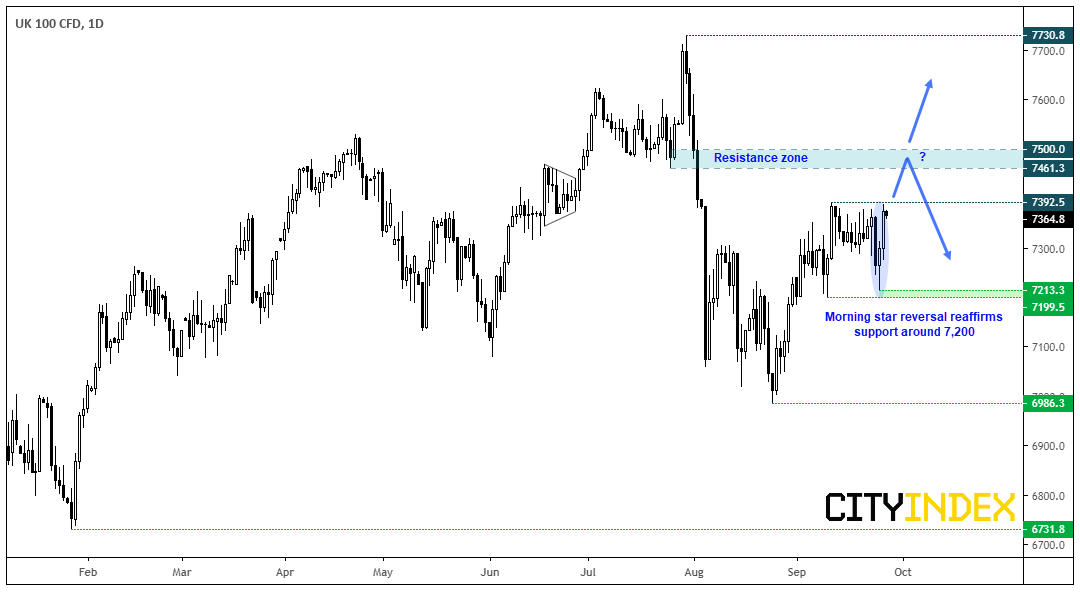
The FTSE 100 has lagged its U.S. and European counterparts this year, but that doesn’t mean it doesn’t try to play catch-up. We noted that U.S. indices have respected key support levels along with USD/JPY, which paints a glimmer of hope we could be headed for a bout of risk-on. If so, it could provide the FTSE100 with a much-needed tailwind and help it break to a new cycle high.
We can see on the daily chart that yesterday’s bullish candle closed just off the highs of a 3-week range. Moreover, Wednesday’s low reaffirmed support around 7,200 before heading higher and is part of a 3-bar bullish reversal pattern at support (the morning star reversal). From here’s we’re looking for a break above 7,392.50 to confirm a breakout, although we’re also mindful that interim resistance awaits around 7,461.30 so this should be taken into account for from a reward/risk perspective.
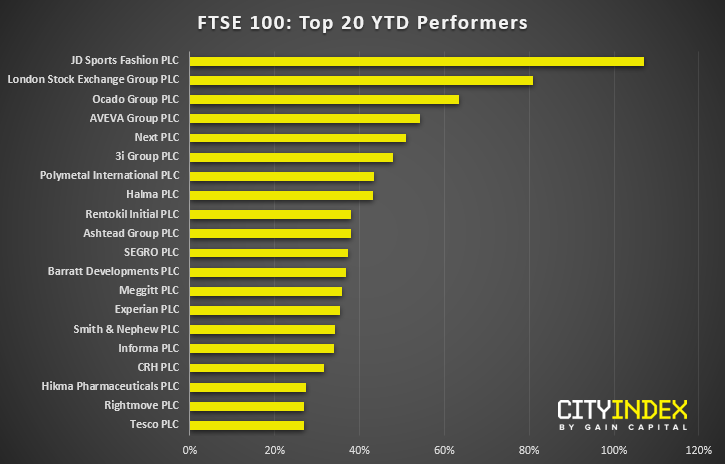
With that said, there’ll still be some stocks within the index which may sustain a better breakout, so we’ve listed the top 20 performers YTD (year to date) and selected three FTSE stocks worth following.
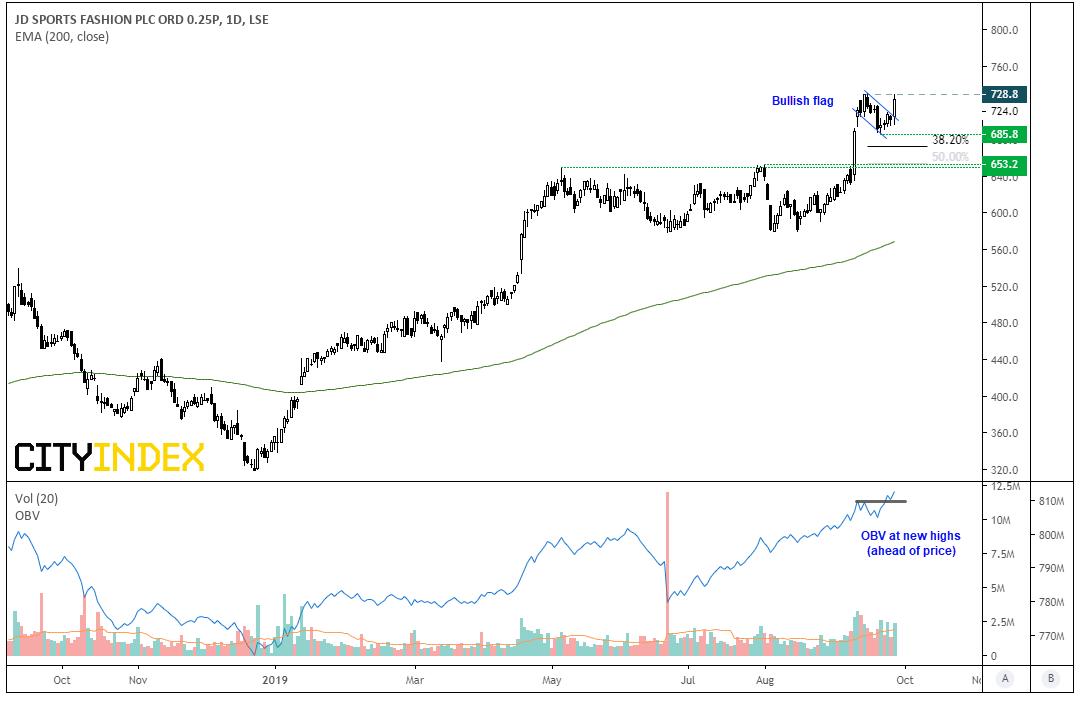
JD Sports (LON:JD) sits just off record highs following yesterday’s range expansion day. That the pullback failed to even test the 38.2% retracement is a testament to the trend’s strength, and momentum has only increased since breaking out of its basing pattern on Sept. 10. The retracement took form of a small bullish flag which is a continuation pattern in an uptrend. Furthermore, as daily volumes remain above average and OBV is at fresh highs ahead of price are encouraging signs for a bullish breakout.
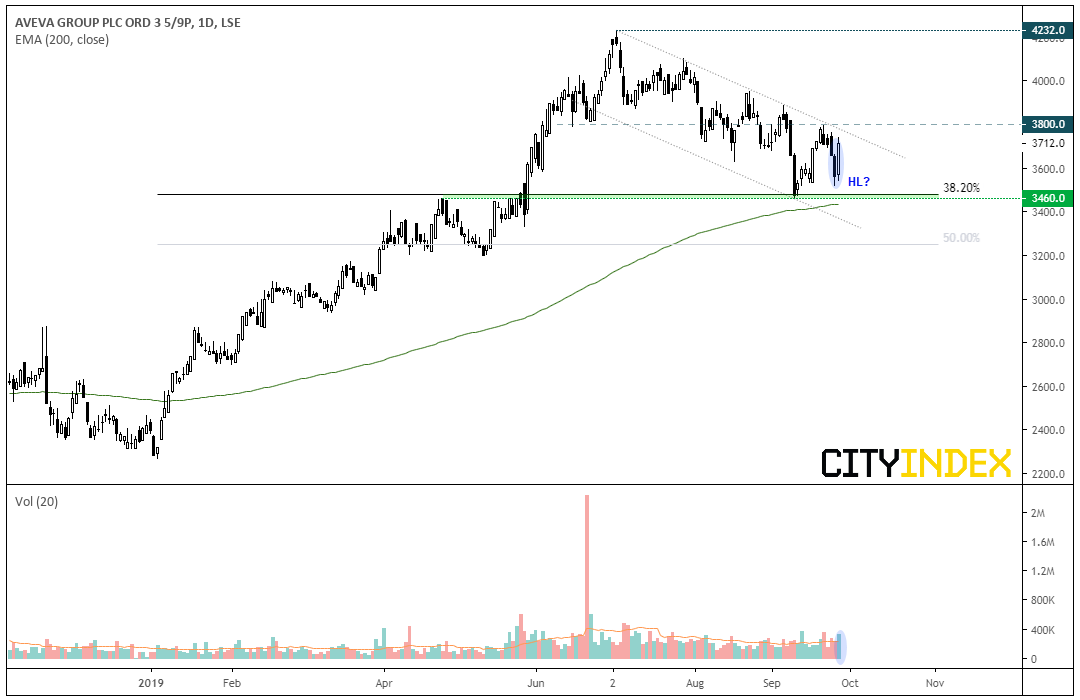
AVEVA Group (LON:AVV) is currently trading within a bearish channel, although there are signs that it could be building up for a break higher to resume its longer-term bullish trend. The September low found support at the April high around 3460, which is near the 38.2% Fibonacci retracement level and above the 200-day eMA.
Yesterday’s 2-bar reversal marks a potential higher low, so a base could now be forming ahead of a bullish breakout. Volume was also above average yesterday which is an encouraging sign for a break higher.
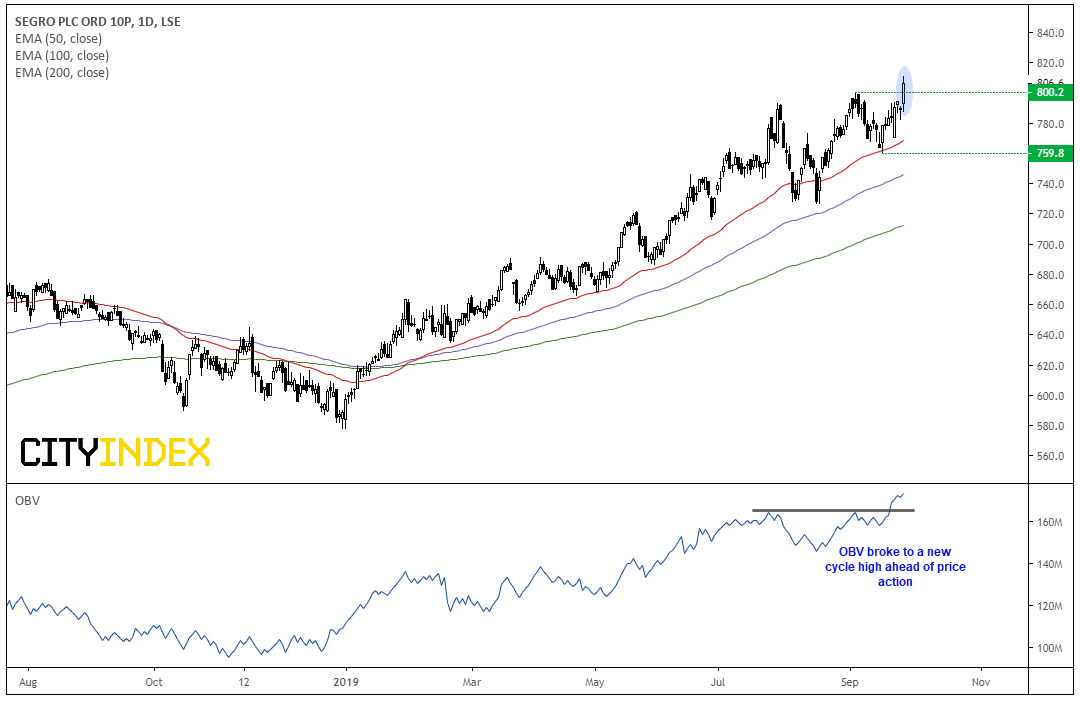
Segro (LON:SGRO) trades in a clearly defined uptrend and the moving average are within bullish sequence and all pointing higher, to show momentum across multiple timeframes is bullish. Yesterday the stock broke and closed to a new cycle high above 800. Moreover, OBV (on balance volume) broke higher ahead of the breakout to show bullish demand was picking up.
