FTSE Is On The Back Ropes As It Heads Towards A Historically Bad Month

Published 05/31/2019, 07:27 AM
UK100
-

It’s the last day of the month and, barring a miraculous recovery into the close, the FTSE 100 is headed for a 3-week, bearish reversal pattern with seasonality working against it.
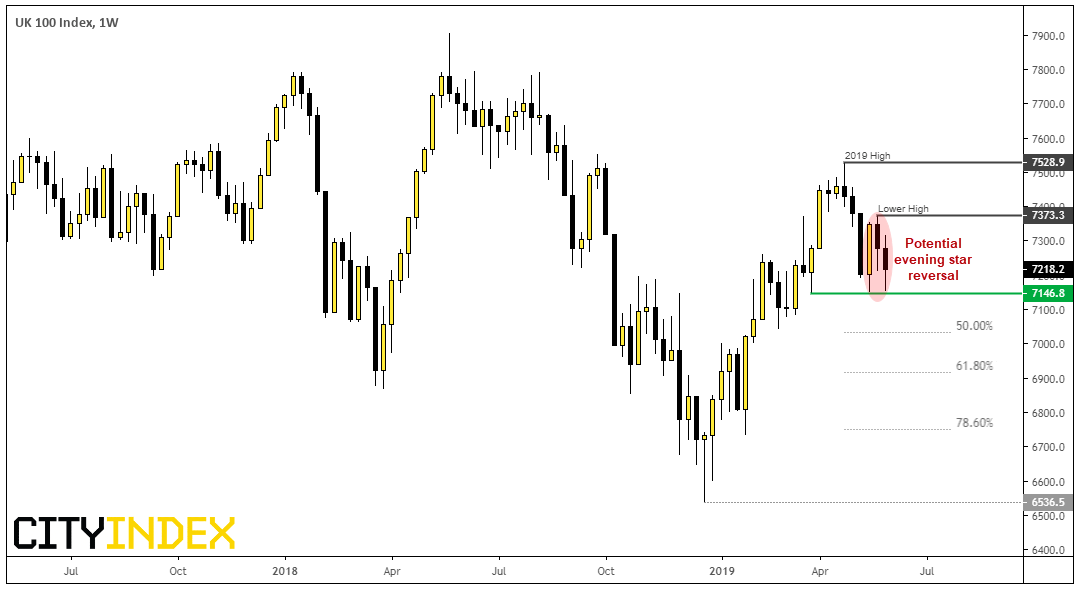
UK 100 Index 1 week Chart

We can see on the weekly chart that an evening star reversal pattern is on the cusp of being confirmed. Moreover, last week’s high provides a lower-high beneath 7528 (YTD high) so bears are slowly relinquishing control. However, we’ve seen three tests of 7146.80 which is currently providing support, which makes 7146.80 is the line in the sand for bulls and bears. Whilst candlestick patterns do not project targets by themselves, we can combine them with other forms of analysis.
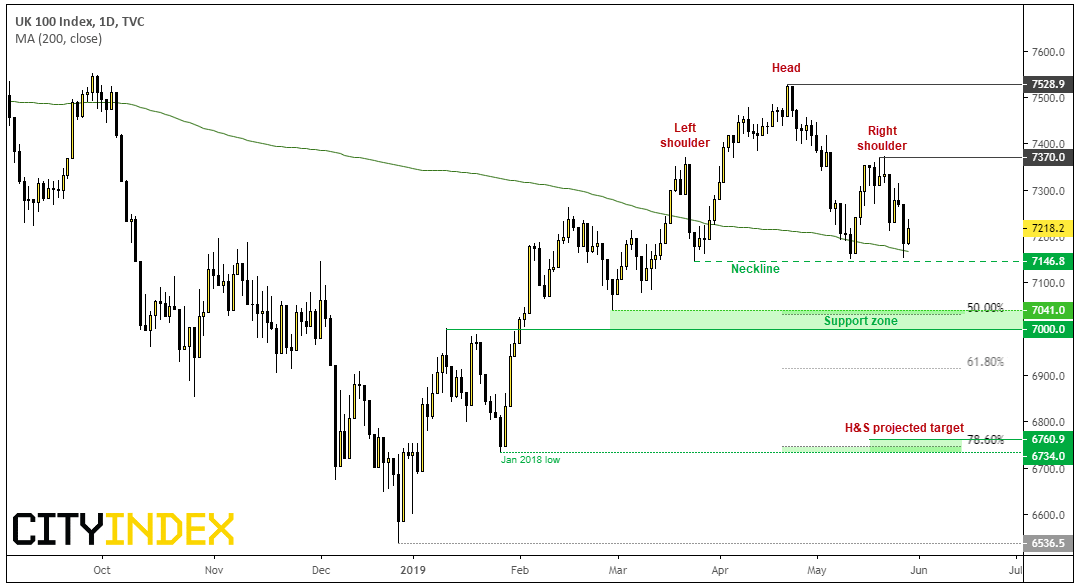
UK 100 Index 1 Day Chart

Switching to the daily chart shows a potential head and shoulders reversal chart which, if successful, projects an approximate target around 6760, and area which coincides with the 78.6% Fibonacci retracement level and January 2018 low.

Of course, it won’t be without its obstacles as the FTSE needs to clear the 200-day average, break below the 7146.80 neckline and of course the cluster of support around 7,000. But if it can break the neckline, there are targets around 7,000 and the January lows that bears will keep an eye on.

Obstacles aside, keep in mind that June has historically been a bad month for the FTSE100, so if its seasonal tendency is to play out this year, it adds another string to the bow of the bearish case.
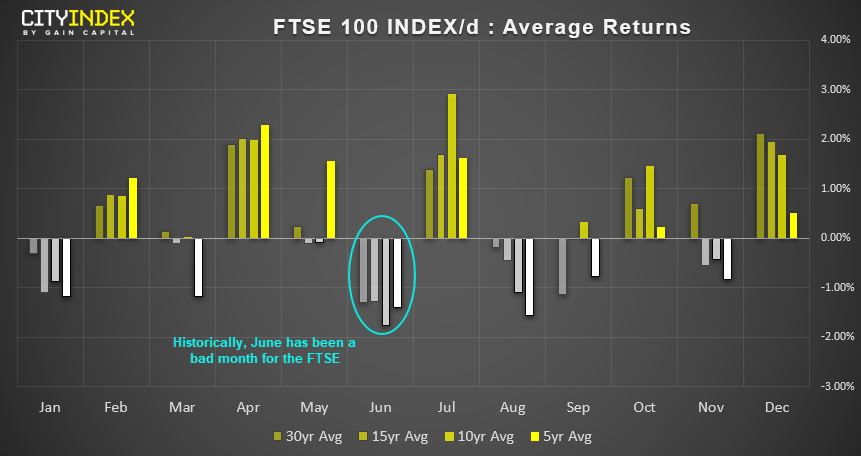
FTSE 100 Index 1 Day Chart

FTSE 100: Over the past 30 years, in June:

  • 70% have been negative months (the highest loss rate through the year)

  • Average return in -1.3% 9 (2nd most bearish month, behind August)

  • Average negative return of -2.8%

  • One of only three months in the year to see a negative average return, over 50% of the time (January and September are the other two)

Of course, in all the time 7146 holds as support, we could see a bounce higher. Yet the potential head and shoulders patterns remains as long as 7370 holds as resistance.

Original Post

Latest comments

Loading next article…
Risk Disclosure: Trading in financial instruments and/or cryptocurrencies involves high risks including the risk of losing some, or all, of your investment amount, and may not be suitable for all investors. Prices of cryptocurrencies are extremely volatile and may be affected by external factors such as financial, regulatory or political events. Trading on margin increases the financial risks.
Before deciding to trade in financial instrument or cryptocurrencies you should be fully informed of the risks and costs associated with trading the financial markets, carefully consider your investment objectives, level of experience, and risk appetite, and seek professional advice where needed.
Fusion Media would like to remind you that the data contained in this website is not necessarily real-time nor accurate. The data and prices on the website are not necessarily provided by any market or exchange, but may be provided by market makers, and so prices may not be accurate and may differ from the actual price at any given market, meaning prices are indicative and not appropriate for trading purposes. Fusion Media and any provider of the data contained in this website will not accept liability for any loss or damage as a result of your trading, or your reliance on the information contained within this website.
It is prohibited to use, store, reproduce, display, modify, transmit or distribute the data contained in this website without the explicit prior written permission of Fusion Media and/or the data provider. All intellectual property rights are reserved by the providers and/or the exchange providing the data contained in this website.
Fusion Media may be compensated by the advertisers that appear on the website, based on your interaction with the advertisements or advertisers.
© 2007-2025 - Fusion Media Limited. All Rights Reserved.