Coronavirus panic selling hit stocks and asset classes across the board on Thursday. The FTSE closed down over 10%, the DAX 12% and U.S. stock indices ended the session 9-10% lower. Ironically on Friday 13, Black Friday, things are looking up (at least momentarily)
Fed Tried, More To Come?
After a wild week on the markets hopes of a Fed stimulus package are boosting stocks in early trade on Friday. Europe has opened on the front foot and U.S. futures are pointing higher. The turnaround comes as central banks from U.S. to Australia pump liquidity in the financial markets and as investors become hopeful that U.S. Democrats and Republicans could pass a stimulus package on Friday. Washington may be late to the party, but they are still more than welcome.
So far, U.S. Government bureaucracy has not kept up with the nature of the coronavirus outbreak and market needs and expectations. The Fed did its best last night with a three-day $1.5 trillion liquidity injection into the markets. There are hopes for another rate cut and QE when the FOMC meets next week.
Light At End Of Tunnel (Which We Are Just Entering)
After stocks experienced the worst sell of since Black Monday over 3 decades ago, there is a sense that the market has more than priced in the negative impact that coronavirus headwinds could bring. Let’s not forget that China has recorded the lowest level of infections with just 8 new confirmed cases. This proves that with containment measures such as lock down, strict quarantine and travel restriction it is possible for a country to rebound and relatively quickly. China has sent a specialist team to Italy to help get control over the outbreak. There is light at the end of the coronavirus tunnel, which in Europe and U.S. we are just entering.
FTSE Levels To watch
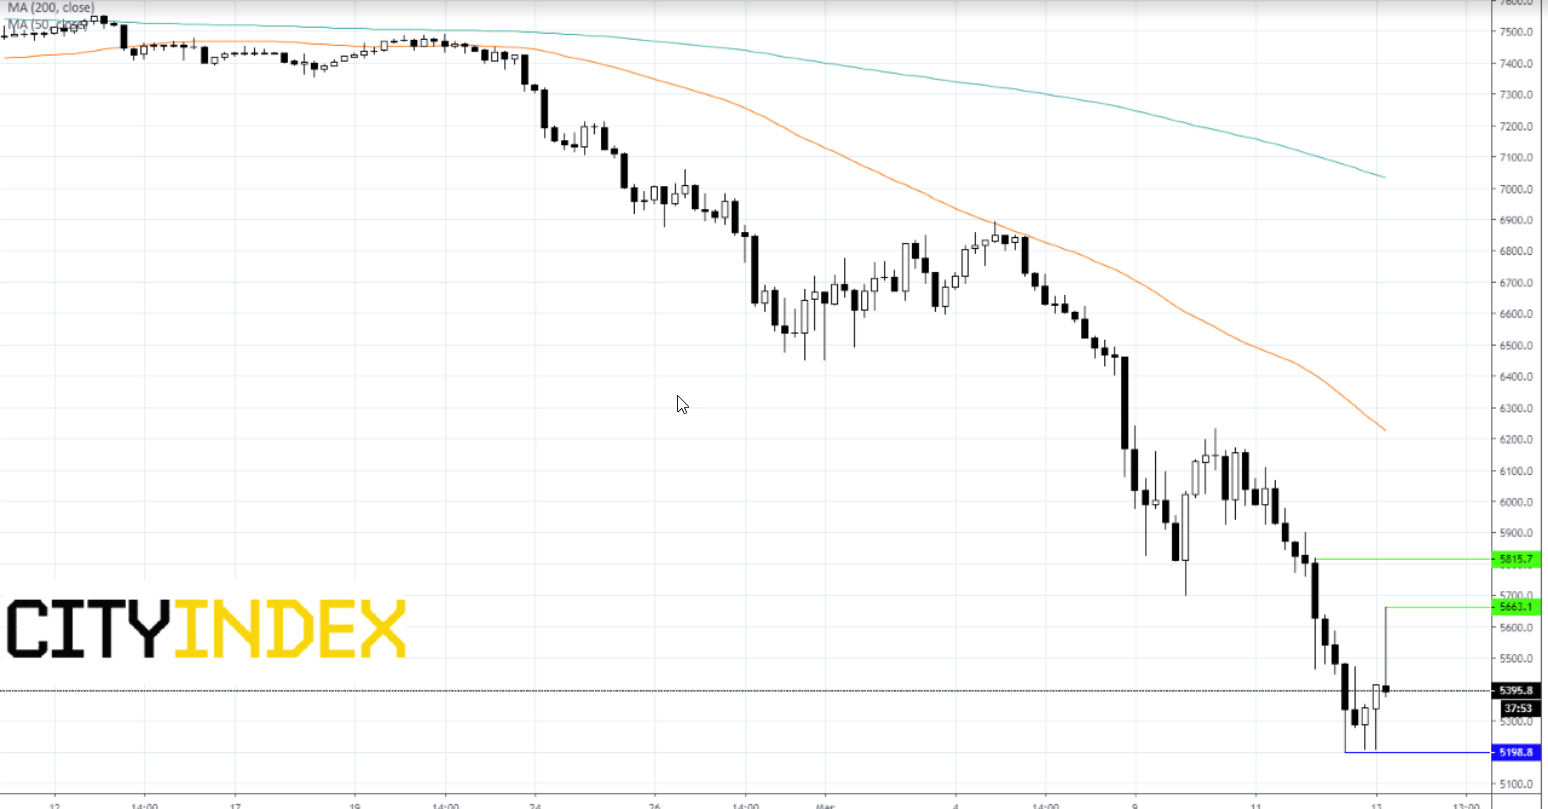
However, the chart is not quite so convincing. Any stronger starts that we have seen this week have not been sustained into the afternoons so there is plenty of caution on trading floors this morning.
The FTSE is up 2% after initial opening volatility at 5345. The 4-hour chart shows a bearish chart, however strong support can be seen at 5202/7 (low from today and yesterday). This level also provided support in May and June 2012. This is an important level. A break through here could open the door to support is seen at 5070 (low Nov’11)
Resistance can be seen at 5663, today’s high and 5815 (Monday’s high).

