2018 has been pretty amazing for indices. For example, on American exchanges, almost all trading days this year have been positive. European indices were a little bit behind but they've been doing their best. Europe hasn't gotten help from local governments like the US has enjoyed with its tax or infrastructural reforms. And Europe has had negative factors to contend with, as well: for the FTSE it was Brexit, while for the DAX there have been problems in Germany forming a coalition together with the strong EUR.
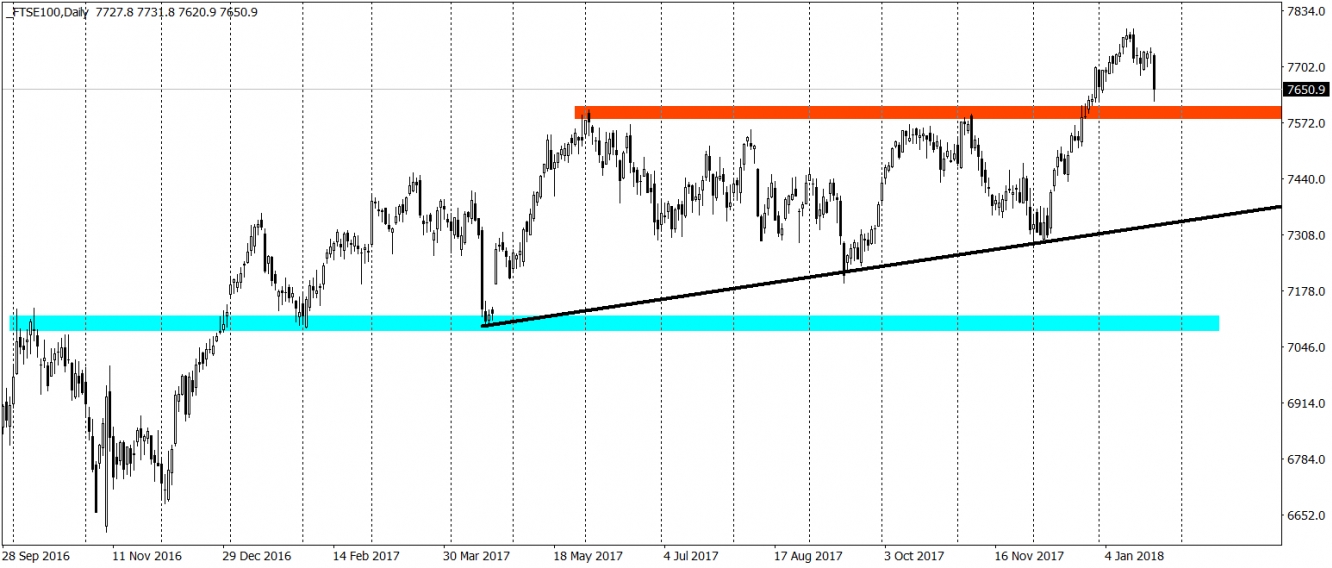
Today, we will focus on the FTSE, where since April the price has been forming a beautiful long-term ascending triangle pattern. The formation resulted with the bullish breakout of horizontal resistance - movement which was largely anticipated. After the breakout, the price went significantly higher and set new long-term highs. One thing was missing though. We did not test the recent resistance as a closest support. That kind of movement is one of the principles of price action trading and is a great occasion to enter trade if the original upswing was missed. Now is the time for that. Wednesday's session ended with a strong drop, which aimed at the 7600 support. Gravity should help here and there's a high chance of getting there in the near future.
Every bullish price action on the red horizontal support, like a candlestick formation or a price pattern, will be a great occasion to go long. Every trader should be monitoring this situation very carefully as the potential risk to reward ratio here is very tempting.

