Market Sentiment took a 180-degree spin during the Asian morning today, as China’s Hubei reported a huge jump in the number of new cases and deaths due to the coronavirus. In the FX world, the Loonie was the main gainer, aided by the recovery in oil prices, while the euro was the main loser, with EUR/USD falling below last year’s low. As for today, investors may pay extra attention to the U.S. CPIs for January.
MARKETS TURN RISK-OFF AS CORONAVIRUS CASES SKYROCKET
The dollar traded higher against all but two of the other G10 currencies on Wednesday and during the Asian morning Thursday. It gained the most against EUR, CHF and SEK, while it underperformed only against CAD. The greenback was found virtually unchanged against JPY.
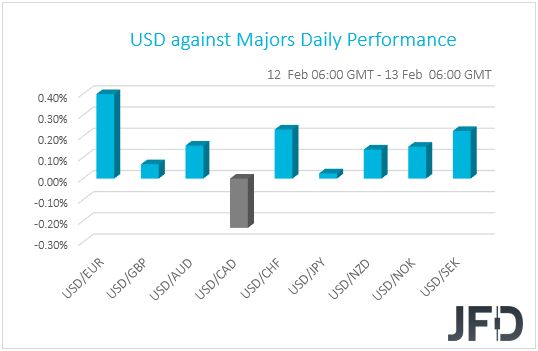
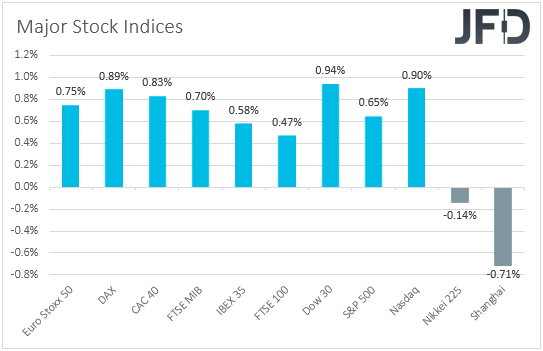
Once again, the performance in the FX world paints a blurry picture with regards to the broader market sentiment. That said, the strengthening of the US dollar and the yen suggests that investor morale took a 180-degree turn. In other words, risk appetite may have taken a strong hit at some point. Indeed, although major EU and US indices continued cheering yesterday’s reports over a slowdown in coronavirus cases, Asian bourses turned south, with Japan’s Nikkei 225 and China’s Shanghai Composite sliding 0.14% and 0.71% respectively.
What fueled the rally was the catalyst behind the overnight slide as well, and this was headlines surrounding the coronavirus. Today, during the Asian morning, China’s Hubei, the epicenter of the outbreak, reported a huge jump in the number of new cases and deaths. Specifically, it reported 14860 new cases, and if we add the cases elsewhere, the number goes to 15159. It also reported 242 deaths, with the worldwide number being 254. Overall, the number of cases globally has surged to 60327, while the number of deaths has risen to 1369.
Remember the graphs we showed yesterday? Those with the % change in cases and deaths in any given day compared to the previous one? Below you can find the same graphs updated, showing how steep the surge was in both cases and deaths. So, we are back in acceleration mode, something that vanished hopes that the virus is nearing its peak, and sparked fresh fears over its effects on the global economic arena. Yesterday, we said that we will not get excited over a long-lasting rally, despite some equity indices hitting new records. Instead, we noted that we will take things day by day, as the risks surrounding any reaction to fresh headlines may asymmetrical and tilted to the downside.

At this point however, it is fair to point out that the surge in cases may be due to Hubei’s health commission starting to include people diagnosed with a new method. In any case, that’s far from encouraging and supports our view that the effects may not be so temporary as many believe. We stick to our guns that further spreading may not only impact Q1 growth, but the economic wounds could well drag into Q2.
Back to the currencies, the Canadian dollar was the main gainer, perhaps aided by the recovery in oil prices. Both Brent and WTI gained 4.37% and 3.06% respectively, perhaps on hopes that OPEC and its allies, known as the OPEC+ group, will proceed with deeper production cuts in order to offset the decline in demand caused by the fast-spreading virus. Last week, producers suggested to reduce output by another 600k bpd, while yesterday, OPEC lowered its demand projections for this year by 200k bps, adding to hopes that the cuts may be delivered as soon as the upcoming gathering, which could take place as early as this month. Some short covering may have also helped the recovery, as those who sold oil on expectations that prices will fall may have now decided to lock some profits.
BRENT OIL – TECHNICAL OUTLOOK
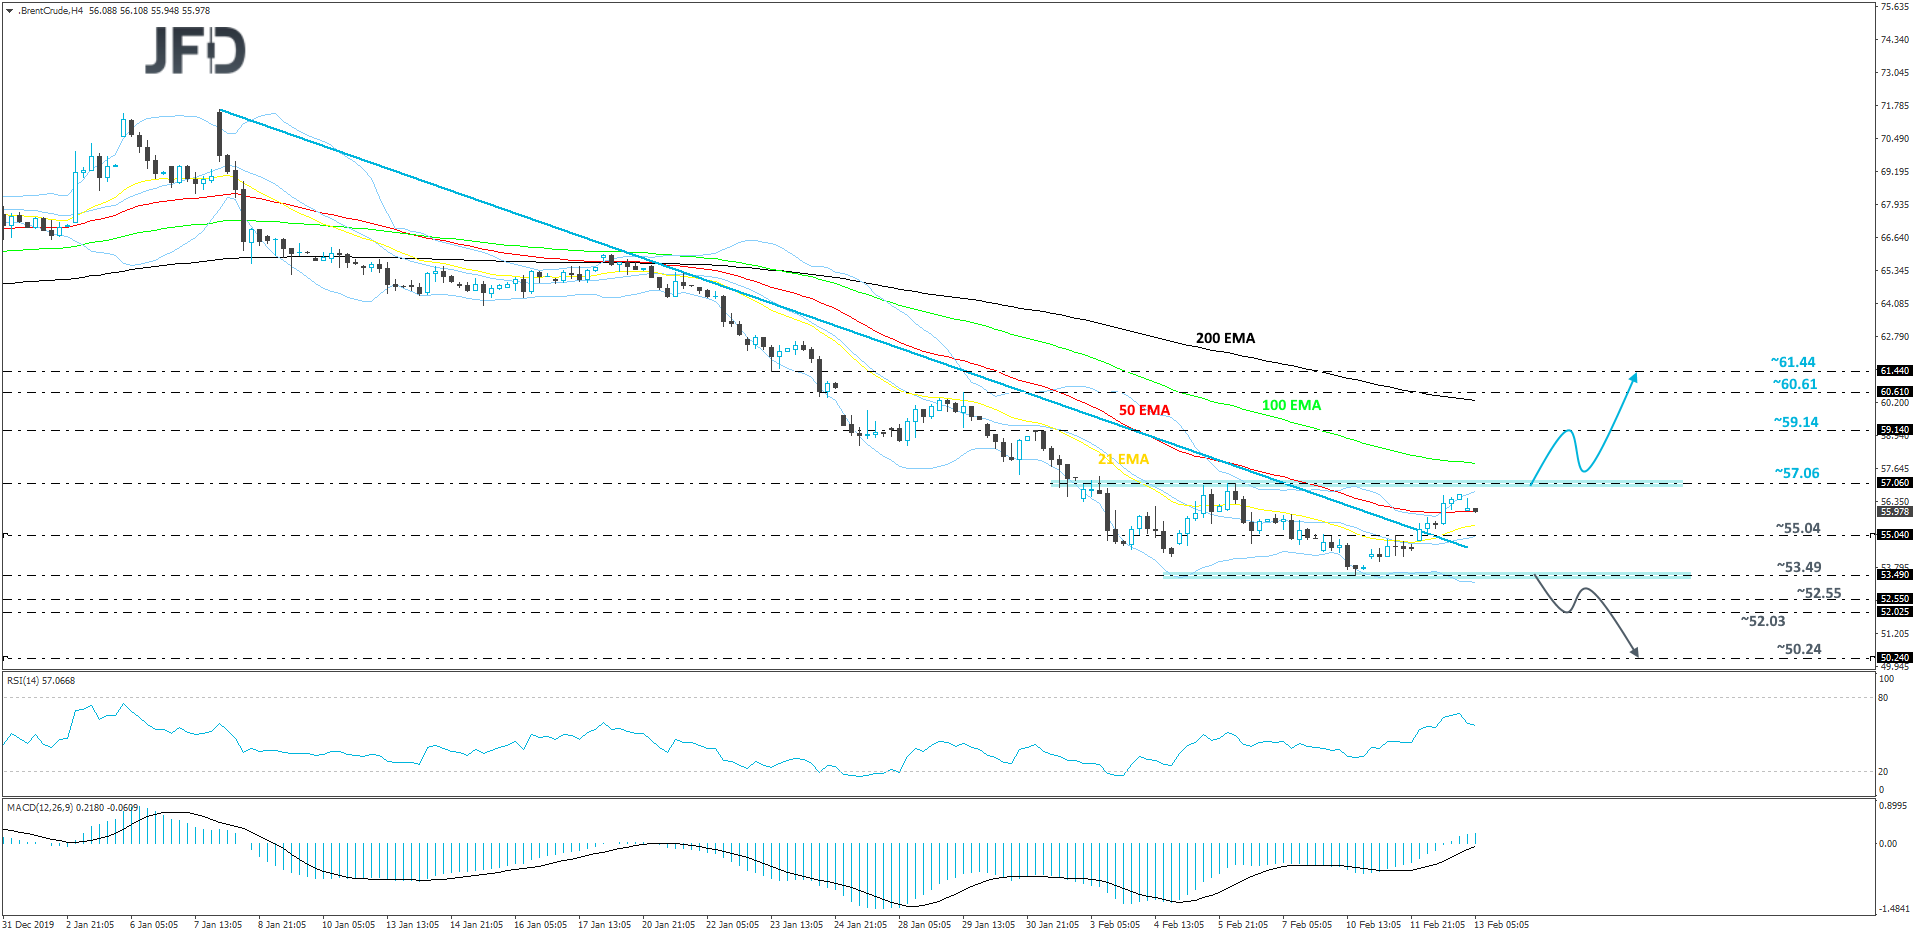
Yesterday, Brent oil managed to break and stay above its short-term tentative downside resistance line drawn from the high of January 8th. But the price got held slightly below the 57.06 hurdle, marked by the highs of February 5th and 6th. Given that the commodity is currently in a consolidation mode, we will take a neutral stance for now. However, we do not exclude a possibility of seeing a bit of a larger correction higher in the near term if the commodity surpasses the 57.06 hurdle.
Indeed, if the Brent oil moves above the 57.06 barrier, this may clear the way to the 59.14 obstacle, as more bulls may join in. If the 59.14 hurdle is unable to slow the bulls down at that stage, a further uprise could lead to a test of the 60.16 zone, or the 61.44 level, marked by the high of January 29th and the low of January 23rd respectively.
In order to get comfortable with the previous downtrend again, we would first like to see a break of the current low of February, at 53.49. Only then we would be able to start examining lower areas, as the move would confirm a forthcoming lower low. That’s when Brent oil may target the 52.55 or the 52.03 levels, marked by the lowest point of 2019 and the lowest point of December 2018. If the slide continues, a further move south could target the lowest point of 2018, at 50.24.
EUR/USD SLIDES BELOW 2019 LOW, US CPIS UNDER THE LIMELIGHT
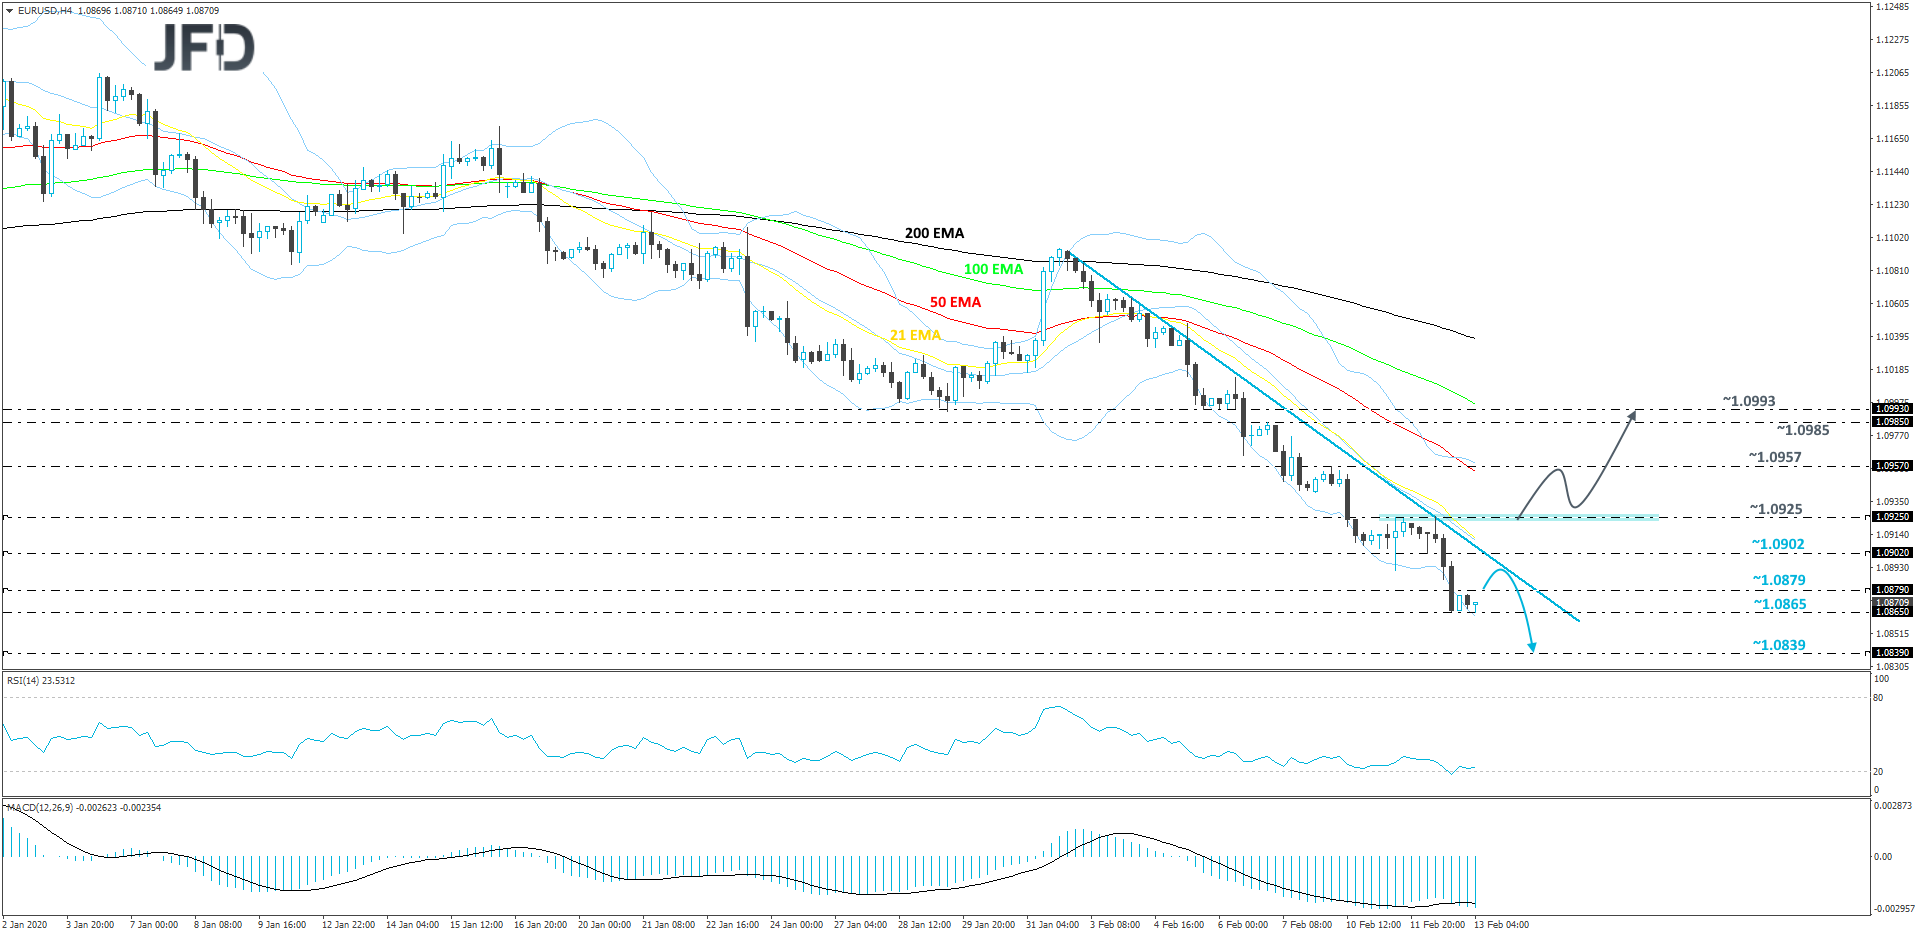
The euro was the main loser, with EUR/USD falling below last year’s low of 1.0879, hit on October 1st. The common currency has been in a steep slide perhaps due to weak data coming out from the Eurozone. Last week, data showed that German industrial production slumped 3.5% mom in December, dragging the Euro area’s monthly rate, which was released on Wednesday, down to -2.1% from +0.2%. This pushed the bloc’s yoy rate down to -4.1 from -1.7%, and could have raised concerns that the second estimate of Eurozone’s Q4 GDP, due out tomorrow, may be revised lower, from a modest 0.1% qoq growth to stagnation.
In any case, a weaker euro may eventually prove helpful for the bloc’s economy, especially given the ECB’s limited scope for further easing. Thus, although the ECB has clearly stated several times that it does not target the exchange rate, a lower euro may be a welcome development for policymakers, as it may alleviate some pressure for additional stimulus in the months to come.
As for today, the main event on the economic calendar may be the US CPIs for January. The headline rate is forecast to have risen further above the Fed’s target of 2%. Specifically, it is expected to have ticked up to +2.4% yoy from +2.3% in December. The core CPI rate is forecast to have ticked down to +2.2% from 2.3%. Having said all that though, the yoy rate of change in WTI crude oil has dropped into negative territory during the month. Thus, if indeed the core CPI slows, we see the risk of the headline CPI to slow more. Don’t forget that the difference between the headline and core CPIs is based on the volatile items of food and energy. On the graph below, you can clearly see how the yoy WTI change tracks the CPI spread.
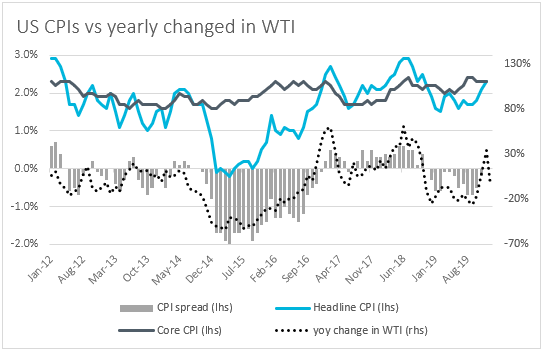
A slowdown in the CPI inflation metrics may raise speculation that the yoy core PCE rate, which is the Fed’s favorite inflation gauge, may slide further below the Fed’s objective. That rate stood at 1.6% in December and has been below the 2% target since December 2018. Thus, speculation of further slowdown in the PCE rate may prompt investors to add to bets with regards to another cut by the Fed, and thereby trigger a dollar correction. According to the Fed funds futures, investors are still pricing in another 25bps cut to be delivered in September.

EUR/USD – TECHNICAL OUTLOOK
Yesterday, EUR/USD came close to breaking its short-term tentative downside resistance line taken from the high of February 2nd. But after testing it, the pair reversed 180 degrees and sold off. This move led to a break of the lowest point of 2019, at 1.0879. After that, the rate drifted a bit further south and found support near the 1.0865 hurdle, which continues to keep EUR/USD afloat. Given the steep down-move, we may see a small pullback soon, but if that downside line remains intact, the pair might stay under pressure, at least for a while more.
A small retracement up could push the rate back above the above-discussed 1.0879 zone and could lead to a test of the aforementioned downside line. If the bulls struggle to overcome that line once again, the bears may quickly take advantage of the lower rate and send it to the 1.0879 hurdle, or even to the 1.0865 area, marked by yesterday’s low. If the selling remains strong, a break of that area would confirm a forthcoming lower low and may clear the way to the 1.0839 level, marked by the lowest point of May 2017.
In order to shift our attention to some higher areas and examine the upside in the short run, we would like to see not only a break of the aforementioned downside line, but also a strong push above the highs of February 11th and 12th, at 1.0925. This way the pair could travel to the 1.0957 obstacle, a break of which might set the stage for a test of a potential strong resistance zone between the 1.0985 and 1.0993 levels.
AS FOR THE REST OF TODAY’S EVENTS
Apart from the US CPIs, we also get the initial jobless claims for last week and expectations are for an increase to 210k from 202k.
As for the speakers, we have one during the Asian morning Friday, and this is New York Fed President John Williams.
