Key Points:
- Following last week’s price action, another major slip could be seen this week.
- Technical and fundamental bias seems to be in line.
- We could see the 0.6861 level tested.
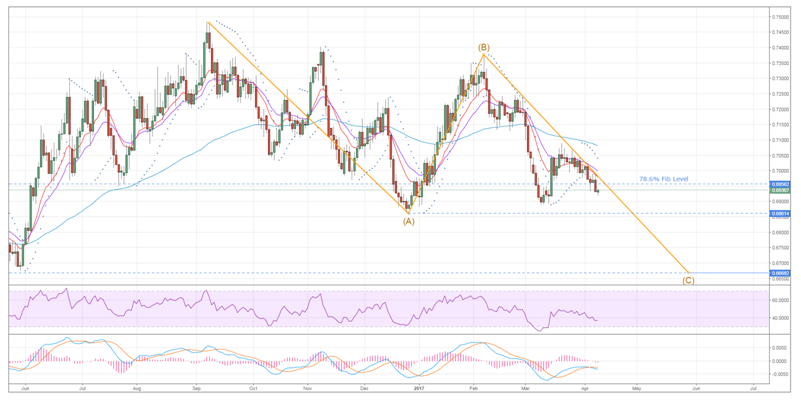
The NZD continues to retrace the long-term ABC wave that was mentioned last week and, after Friday’s major stumble, the chances of seeing it complete are looking even better. As a result, it may be worth looking at how the kiwi dollar got to where it is and what is next on the agenda as this paircould have an exciting week on offer.
Starting with last week’s performance, the kiwi dollar was in decline and experienced two major slips, one on Tuesday and the second on Friday. Starting with Tuesday, the move may have come as somewhat of a surprise given that the GDT Price Index came in at 1.6%, a second consecutive uptick for the index. However, an unexpected improvement in the US Trade Balance offset any potential buying pressure resulting from the GDT data and this saw the NZD experience a rather large slide. As for Friday’s major tumble, this was an understandable response to the sharp contraction in the US Unemployment rate from 4.7% to 4.5%.
Potentially more interesting, is just how well the pair seems to be retracing the larger ABC wave. As discussed last week, the NZD remains fairly faithful to the typical wave formation which seems remarkable given the impact that fundamentals have had over the past weeks. Furthermore, now that the pair has closed below that 78.6% Fibonacci level, we may see it move to challenge the final robust zone of support around the 0.6861 handle. This move alone represents significant downside potential but, more importantly, it might mark the beginning of a severe decline over the coming weeks.

As for the impending week’s fundamental outlook, there isn’t much on the horizon on the NZ side of things, save for the Business NZ Manufacturing Index. As a result, the US data will be the key driver of the pair’s movements and should, therefore, be monitored accordingly. Of particular interest will be the US JOLTS Job Openings figure and the Unemployment Claims numbers which are expected to be fairly solid if the recent unemployment rate is any predictor. Due to this, we do expect to see the pair remain under pressure which would be in line with our expectations of seeing that 0.6861 level tested.
As for the near-term technical readings, the combination of the highly bearish EMA activity, the Parabolic SAR bias, and the recent MACD signal line crossover should see selling pressure intensify. Moreover, the neutrality of the RSI gives the pair plenty of room to sink before risking becoming oversold. Overall, this suggests that we are going to see more of that C leg form which could, in turn, lead to the forecasted breakout required for the long-term ABC wave to complete.
Ultimately, keep an eye on this pair as even if we don’t see a break out this week, there is plenty of downside action to capitalise on. As discussed, both fundamentals and technicals should be in line which makes challenging the 0.6861 handle a very achievable goal. Moreover, if this near-term bearishness is seen, chances of the wider pattern completing will be drastically improved which is also worth thinking about.
