Key Points:
- Deep in overbought territory.
- Challenging a strong resistance level.
- Fundamentals remain in favour of ongoing bearishness.
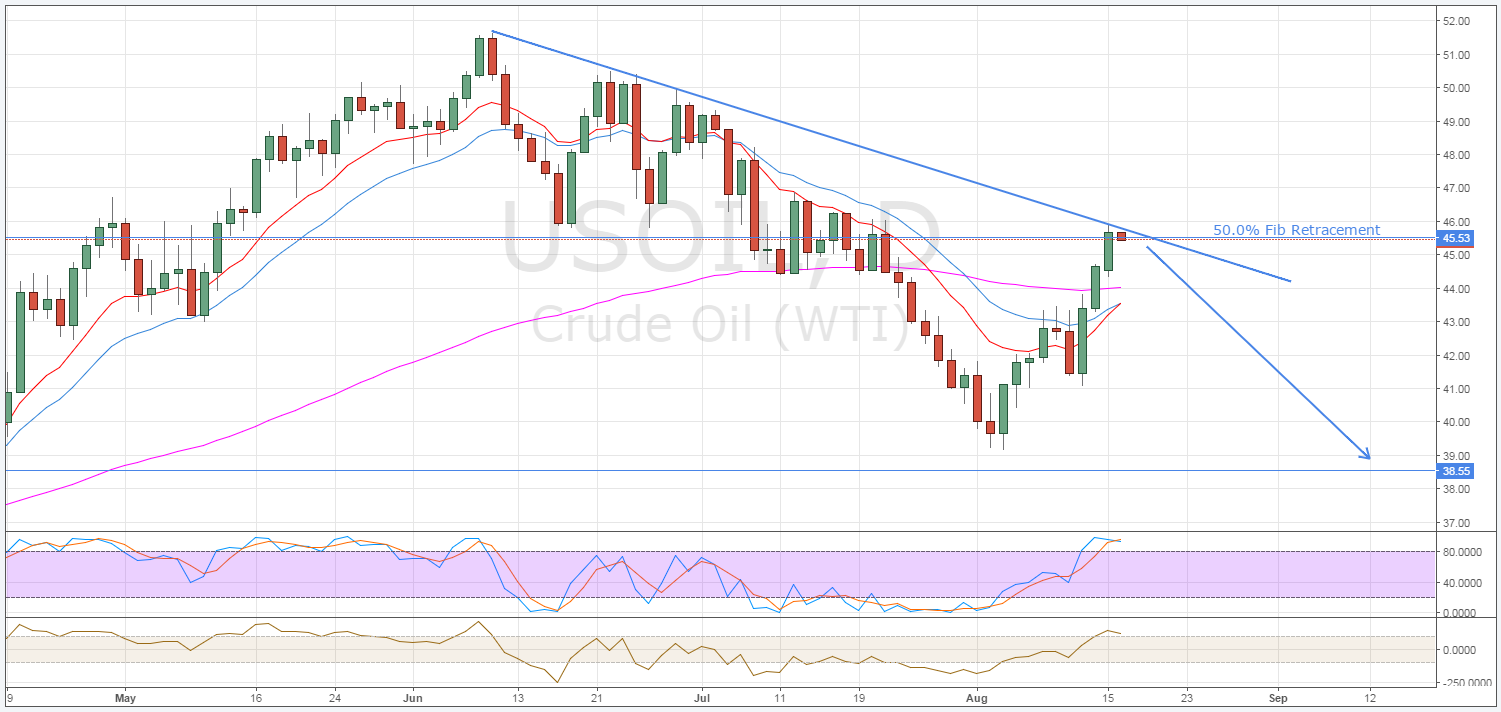
If oil bulls weren’t pushing their luck on Friday, they certainly are now as the commodity’s price is precariously high given the circumstances. Specifically, after pushing through the 38.2% Fibonacci level and the 100 day moving average, oil has moved deeper in overbought territory which could be foreshadowing a severe swing in sentiment over the proceeding sessions. Moreover, forecasts for Wednesday’s US Crude Oil Inventories are in favour of a third consecutive build which could be the spark needed to send the commodity tumbling.
In Friday’s session, oil was already beginning to signal that the recent rally was beginning to run short on momentum and that a reversal was becoming ever more likely. However, the commodity actually managed to defy expectations and surge strongly higher by the end of session which came as somewhat of a surprise given its technical bias. Largely to blame for the jump in oil prices was Friday’s sharp downturn in the USD, this itself being a result of a slew of weak US fundamentals, making the commodity relatively cheaper for non-US buyers.
In addition to this, there is some evidence that the price action could have been the result of a large inverse head and shoulders structure moving closer to completion. Whilst a relatively convincing head and shoulders pattern does indeed appear to be manifesting, the fundamentals simply won’t see this be borne out. As mentioned quite regularly by myself and others, oil is unlikely to be able to remain above the $45-50 handle for any meaningful length of time as a result of a vast range of factors. Chief among these is the constant lowering of US Shale Oil’s breakeven per-barrel price, however, the recent record uptick in Saudi Arabian conventional oil production is also limiting the upside.

From a purely technical perspective, oil prices will also be capped in the coming week by the 50.0% Fibonacci retracement level and the two month downtrend. As shown above, the two resistances should prove to be relatively formidable adversaries for the commodity and seem to already be inspiring a rout. In addition to this, the recent surge in prices has also pushed oil prices further into overbought territory which is begging to be felt. If this wasn’t already causing a few raised eyebrows, the recent movement of the Commodity Channel Index into a similarly overbought state should cast further doubt on any continued bullishness.
Looking at a shorter timeframe, specifically the H1 and H4 charts, a number of other factors are signalling that a reversal is imminent. Firstly, the rally seen over the past two weeks has taken the form of a relatively well defined corrective ABC pattern. Importantly, this pattern is now reached completion which should result in a reversal around the 45.53 level. Secondly, there is a bullish engulfing candlestick pattern on the H4 chart which is likewise indicative that a downturn is in the wings.
Ultimately, the fundamentals alone should be reason enough to be sceptical about ongoing bullishness for oil. However, the technicals are now effectively screaming that the commodity is overbought and readying for yet another surge lower. This being said, trading could be somewhat flat ahead of this week’s US Crude Oil Inventories results which might delay the reversal to some extent. Additionally, a surprise draw in the inventories data could lead to a knee jerk buying frenzy and subsequent rally. If this occurs, it will likely just exacerbate the severity of the eventual collapse in oil prices so keep a close watch on Wednesday’s results.
