It’s Friday and we’re now another week closer to 2017. How time flies when you’re doing something you love like trading.
On the Vantage FX Forex Blog this week, we’ve taken a look at 4 technical-analysis setups and I wanted to use today’s post as a recap of how they played out.
Monday: GBP/USD Retesting Previous Support as Possible Resistance: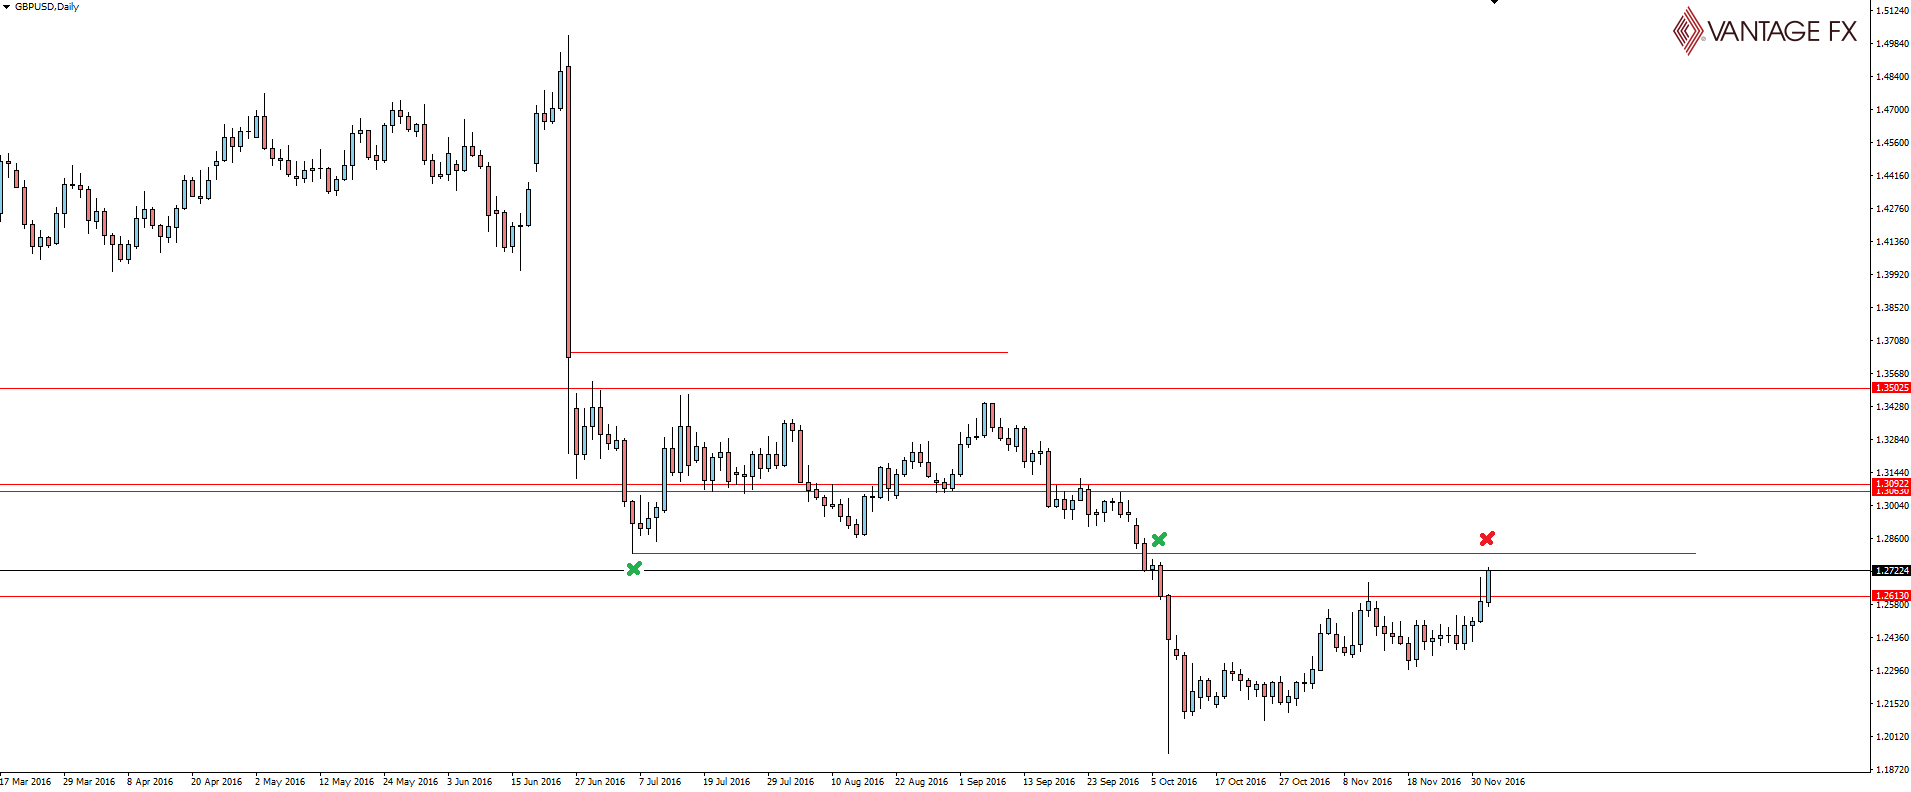
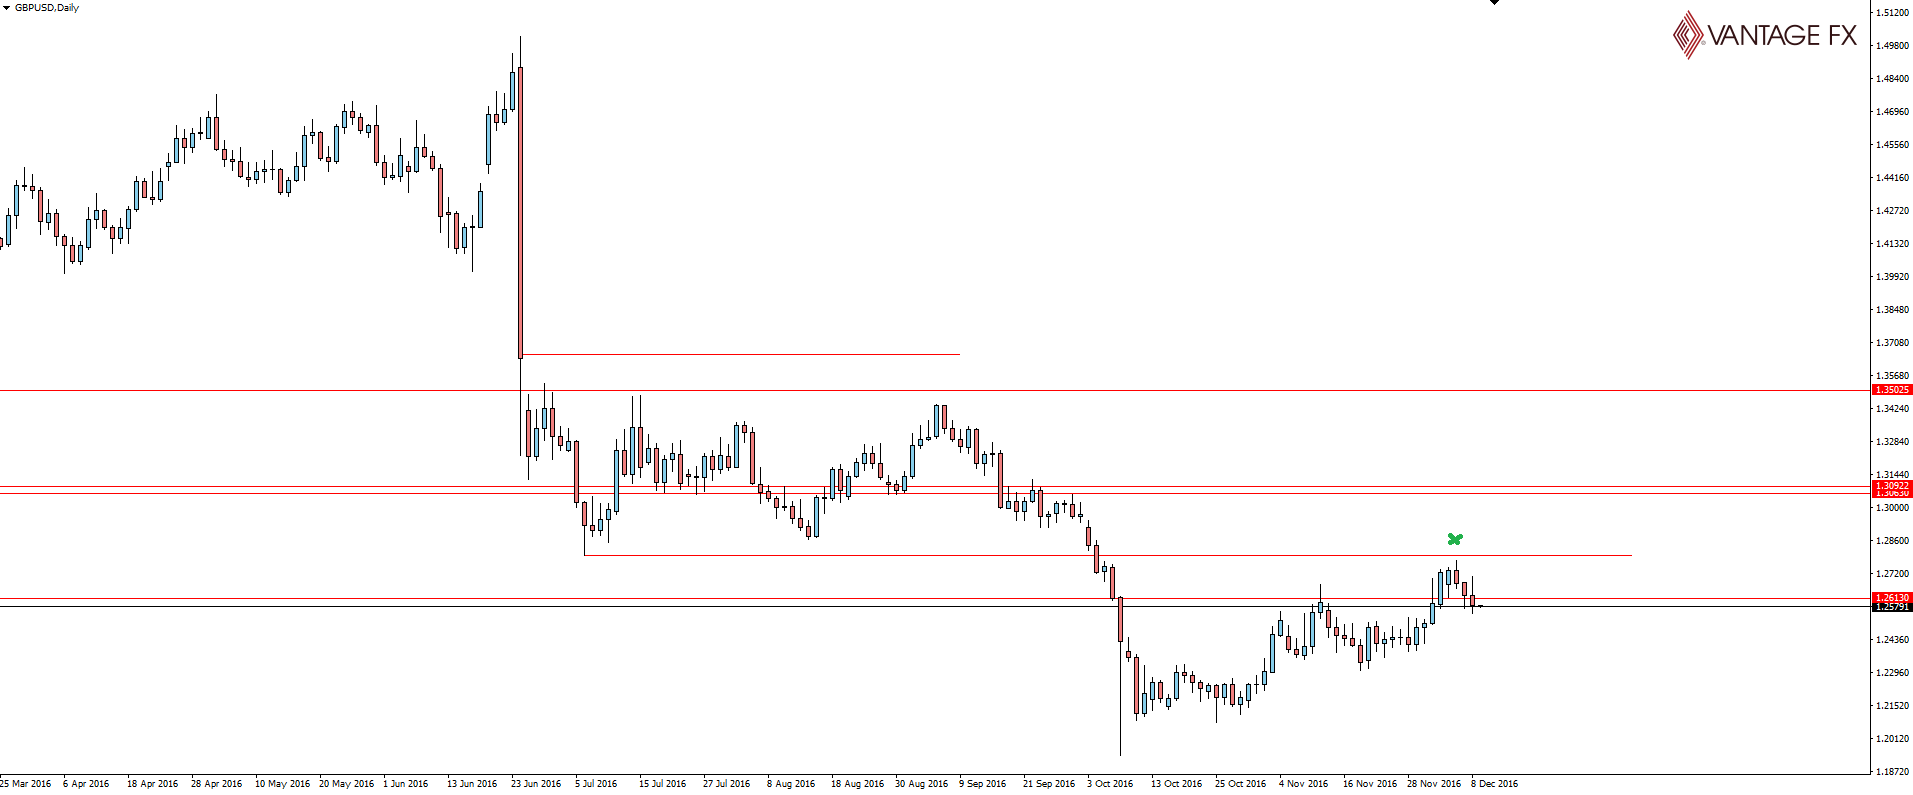
Price failed at the higher time frame resistance level.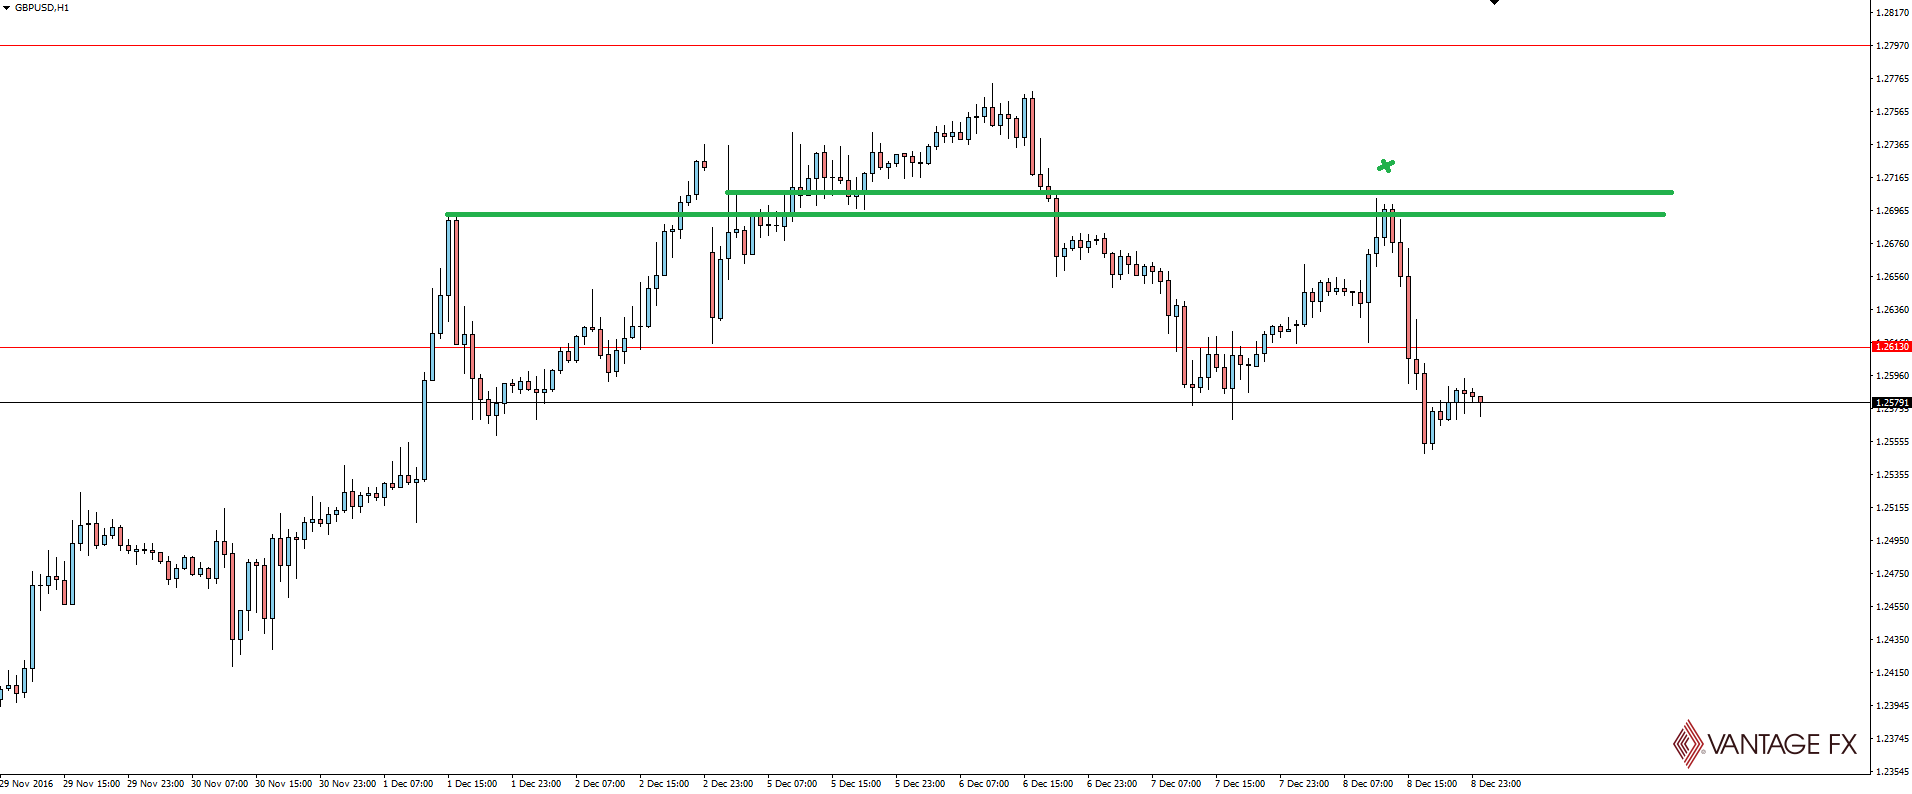
It was then followed by a failure at the first retest of short term previous support turned resistance.
This is the sort of confirmation that we look for to confirm that the higher time frame level has in fact held. They also act as a good risk management point, allowing you to keep your stops tight.
The way it has continued lower after giving us the confimation we were looking for continues to keep Cable acting bearish.
Tuesday: EUR/USD Reverses out of Weekly Support Zone: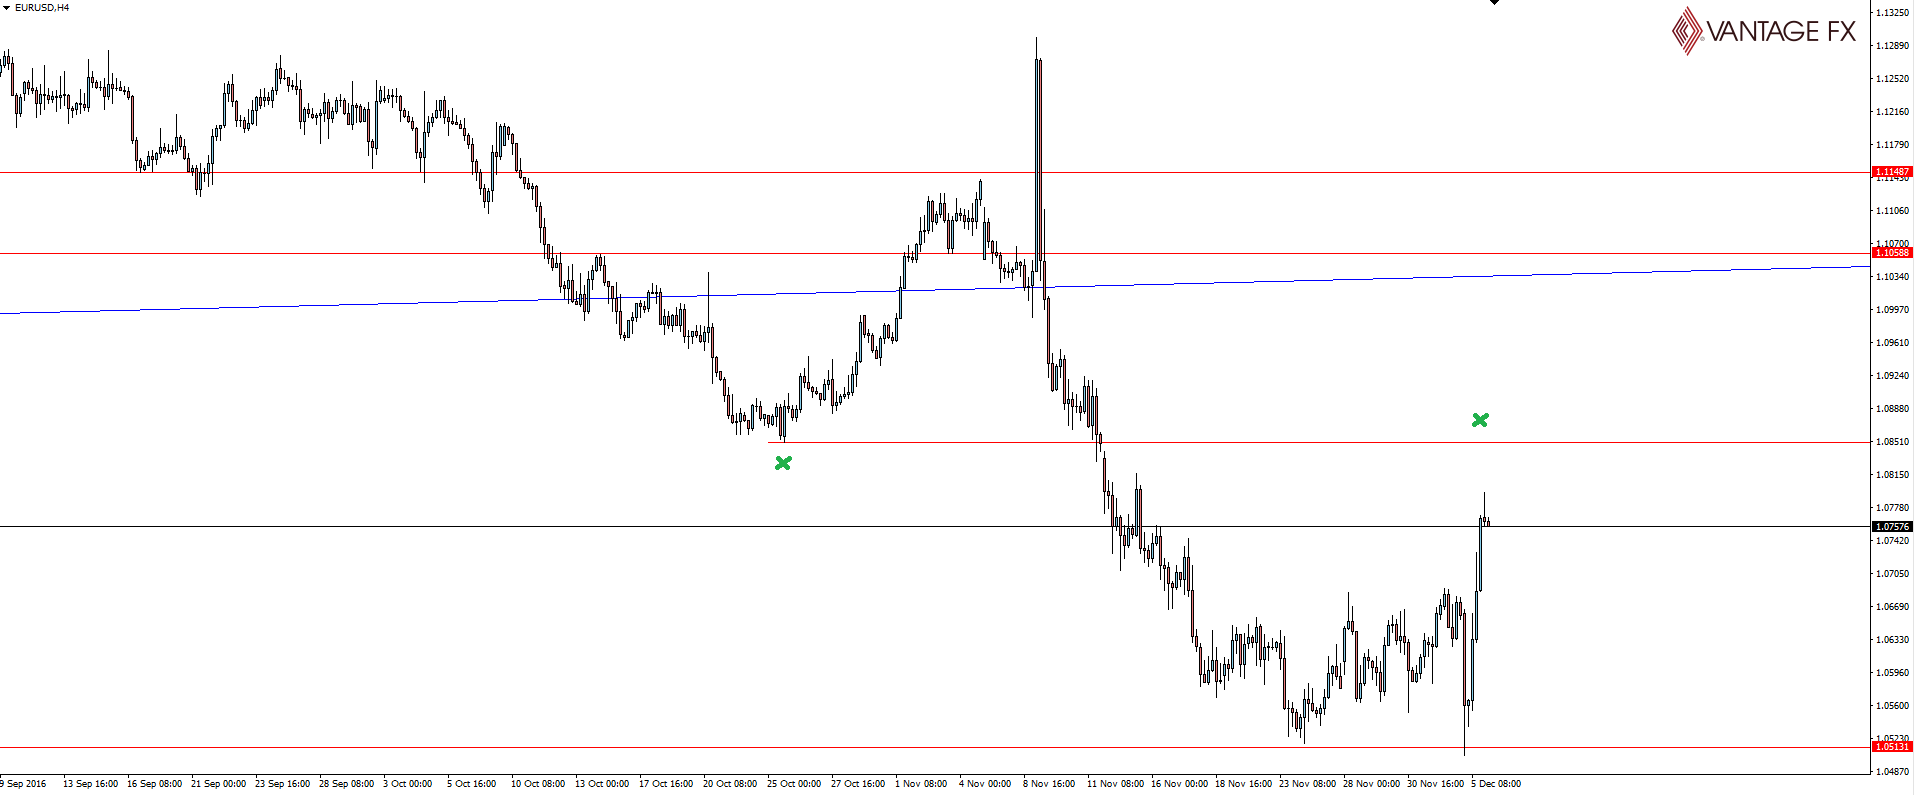
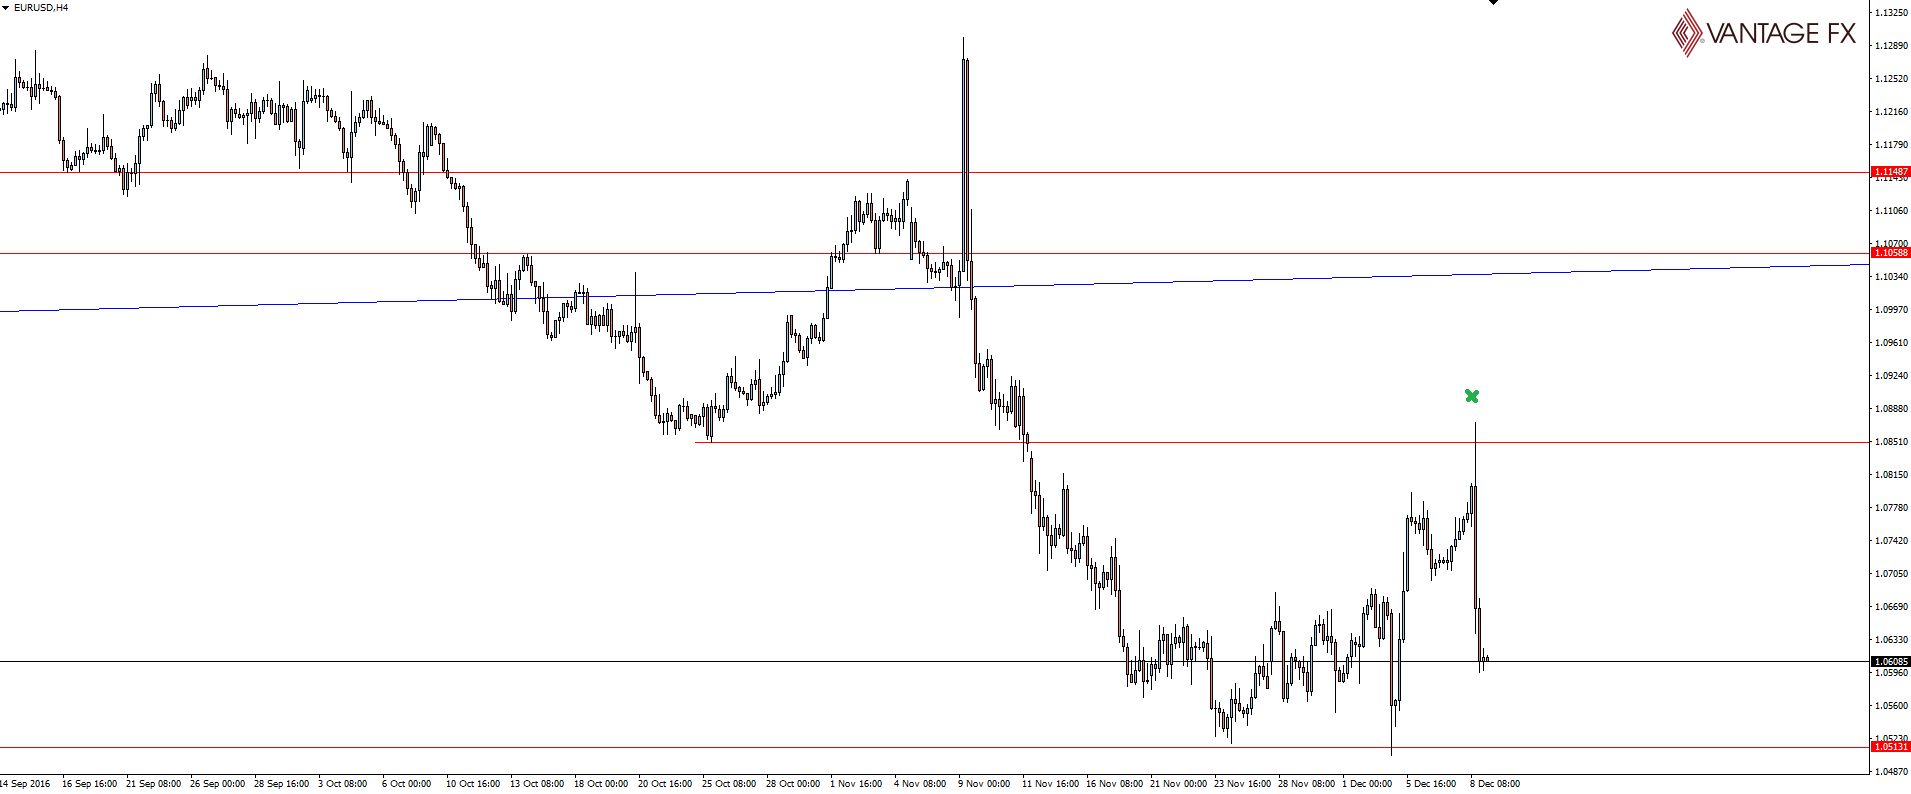
Overnight we got a signal from the European Central Bank that they were looking to slow down their stimulus program from April 2017. This news spooked Euro bulls and dropped the Euro like a stone in a pond.
Coincidently (or not, depending on how you view markets), this news just so happened to line up when price hit the technical level that we were watching on Tuesday, and price sold off hard as a result.
Mark your levels and trade your levels!
Wednesday: Oil at Triangle Resistance Breakout Point:
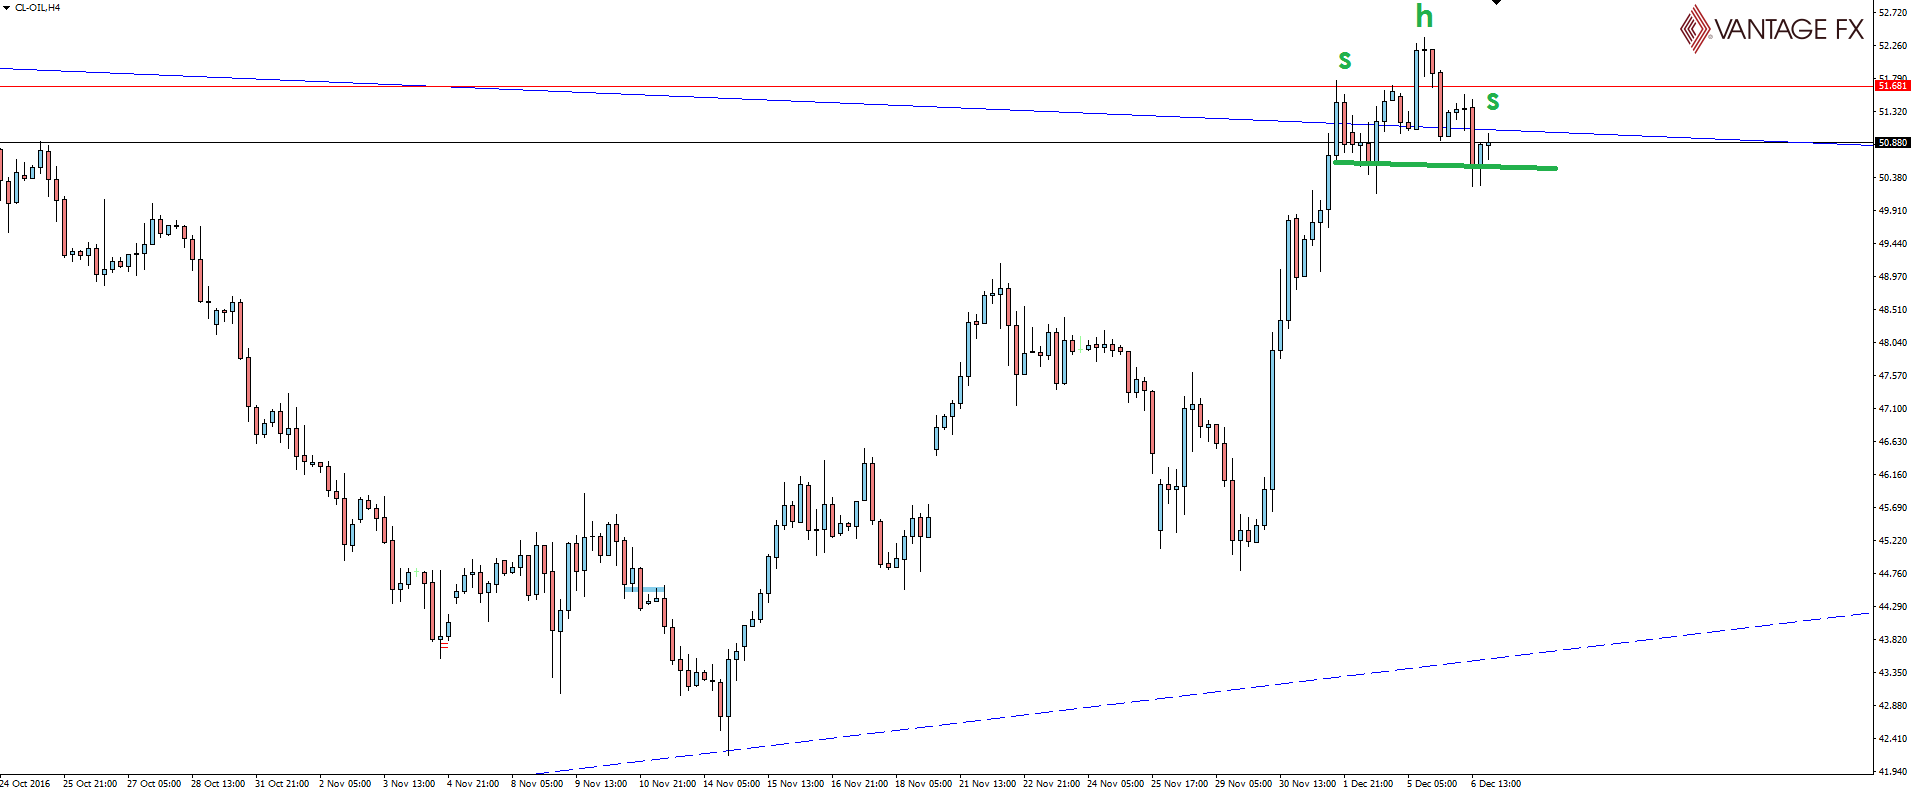
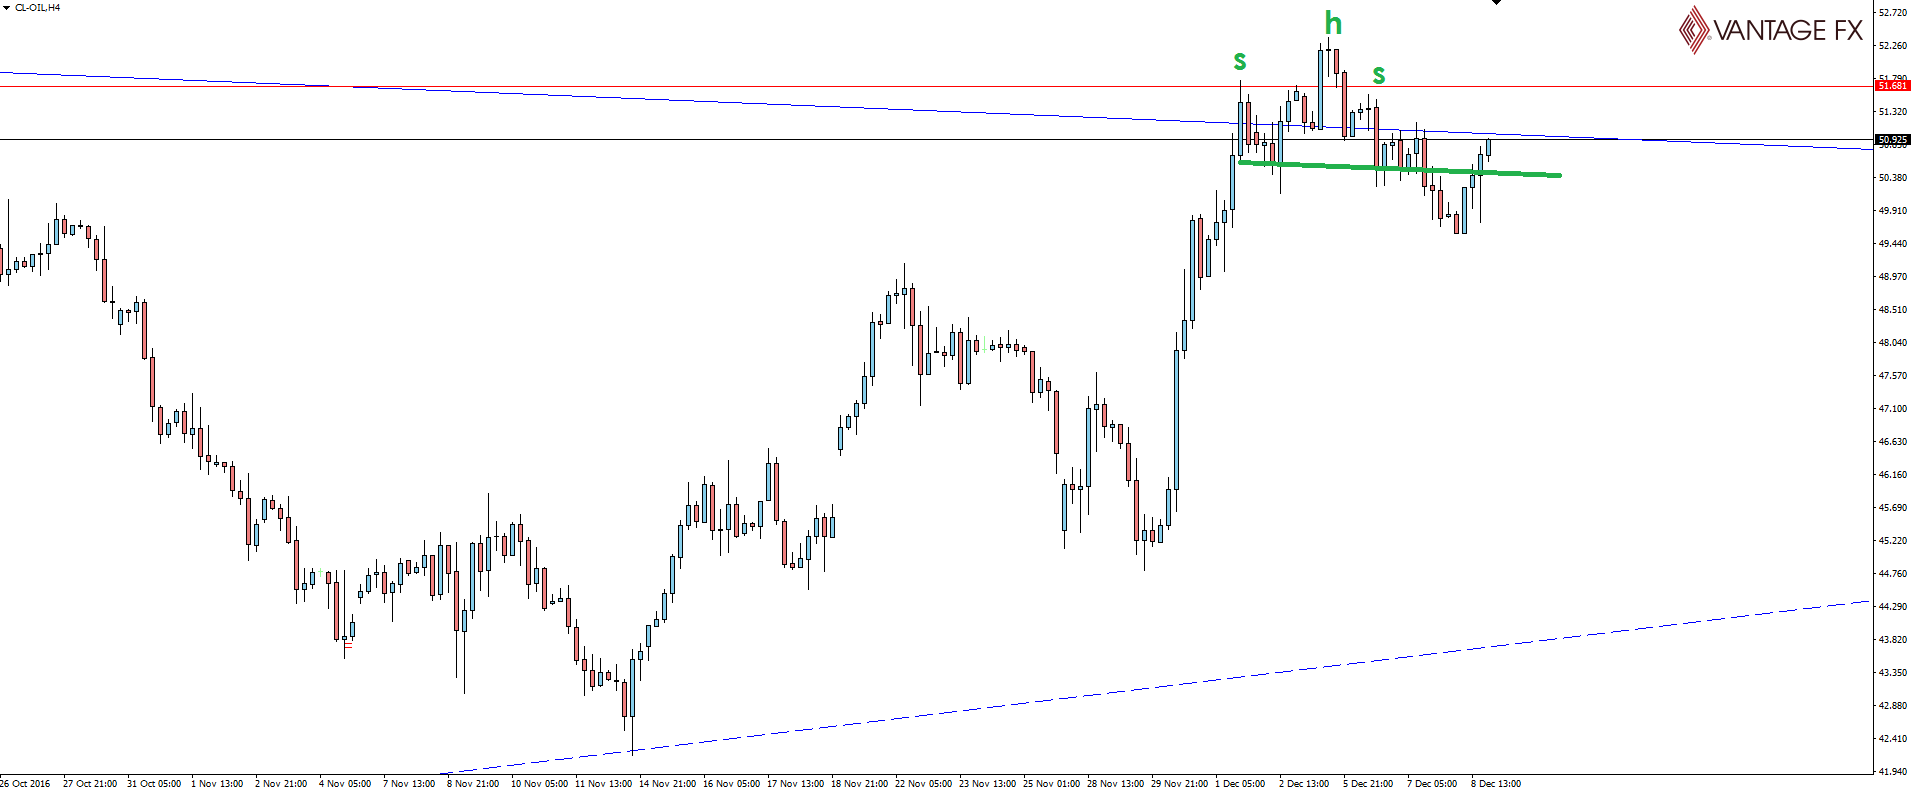
As I said in Thursday’s blog, I’m not the biggest fan of head and shoulders patterns because they are so subjective. Ask ten different people what they see in a head and shoulders pattern on a chart and you’ll likely get ten different answers. I went with this one because it looked to be forming in confluence with the higher time frame trend line resistance level on the daily chart.
The head and shoulders did initially break but that move has now retraced. Price is still below the daily trend line and for that we’re still bearish but using the lower time frame head and shoulders to manage your risk has its problems as you can see.
Keeping things as simple as possible in trading is often the best method and using clear horizontal levels lining up with swing lows and previous indecision in the market is still my go to setup.
Thursday: NZD/USD Momentum Push into Previous Trendline Support: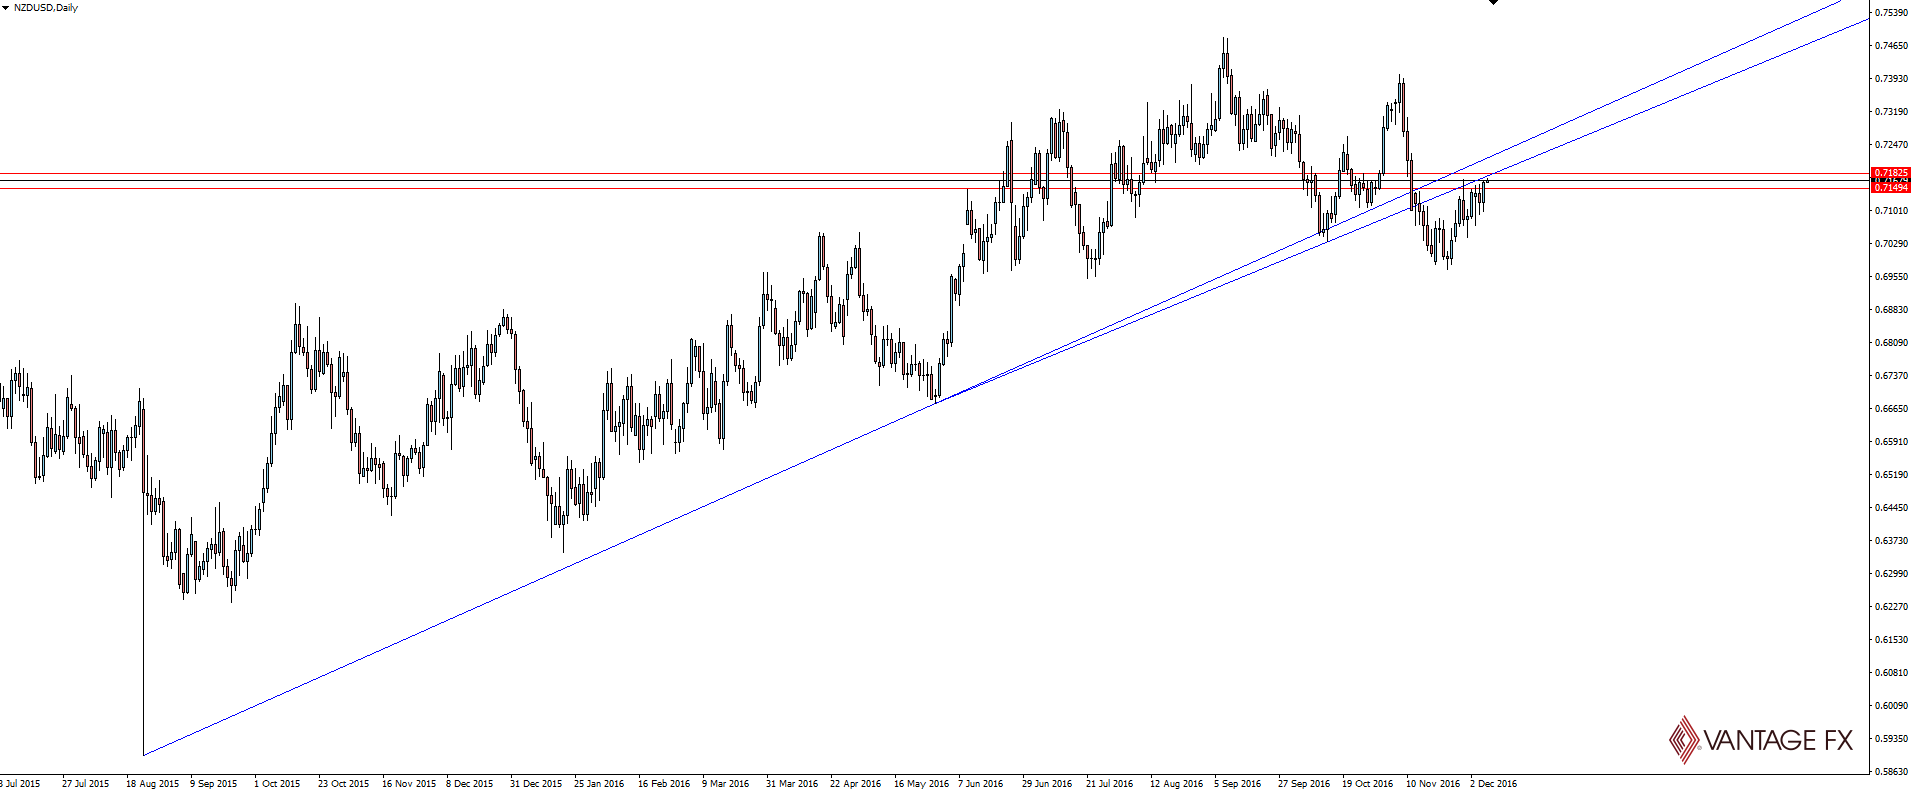
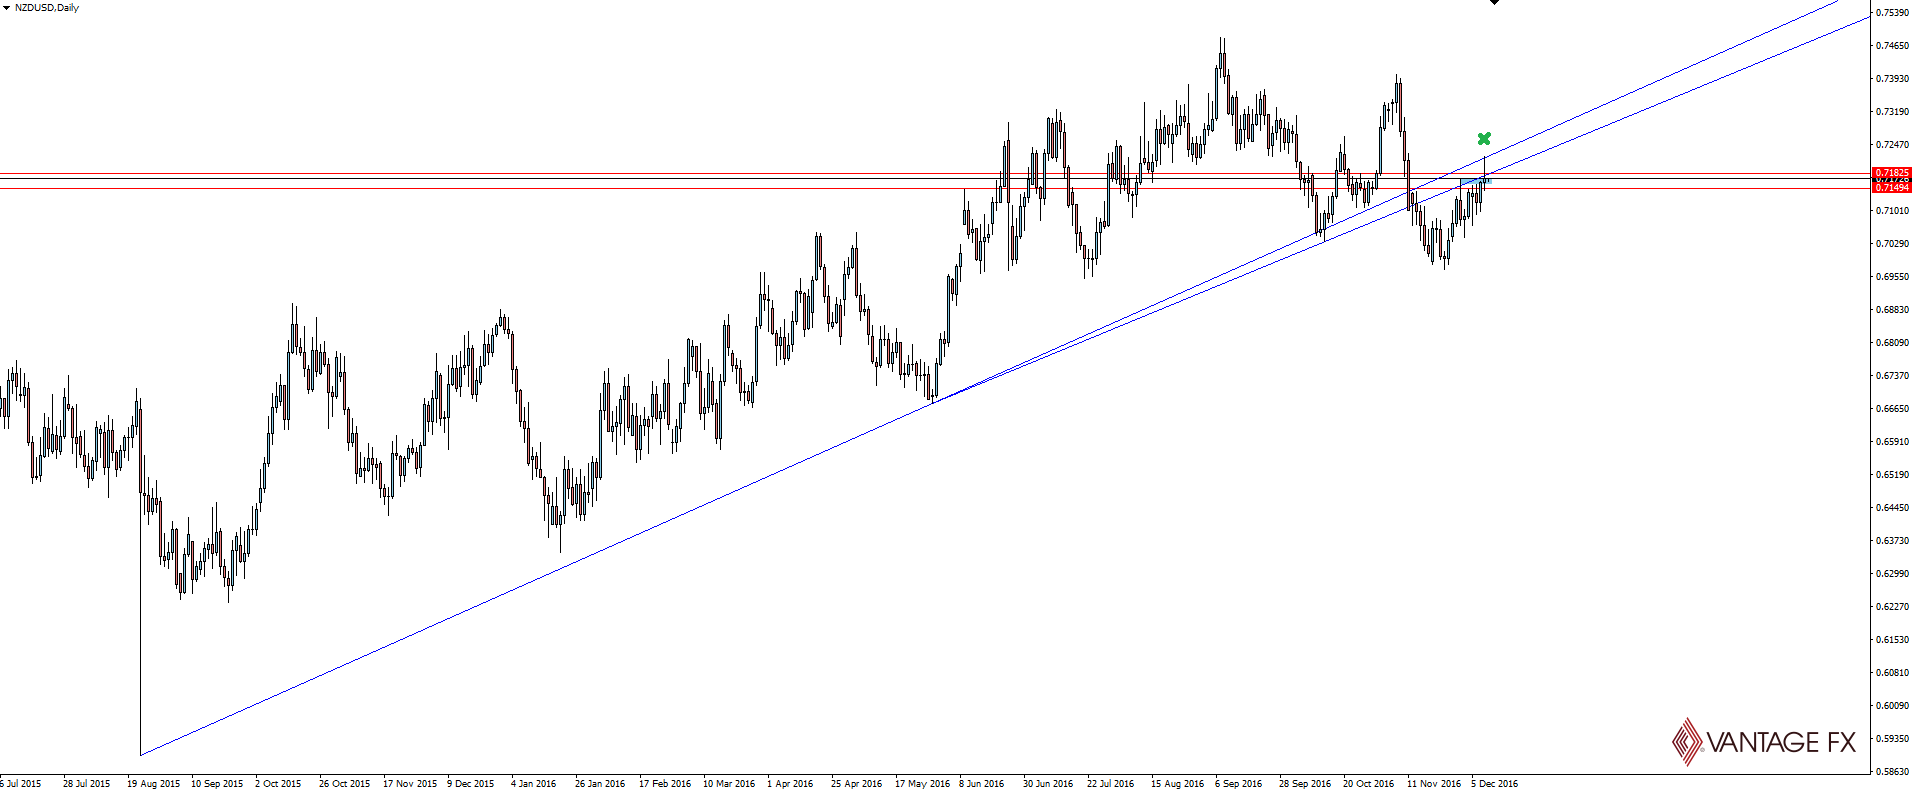
As we Tweeted yesterday, Kiwi climbed above 0.7200 amid upward GDP target revisions by NZ Treasury, but just like the Euro setup above, this was straight into higher time frame resistance and price was uncerimoniously slapped down as a result.
The cautious tone used in yesterday’s blog post is still relevant. Just because the first touch was slapped down 70 pips isn’t a strongly bearish signal alone. I’m not rushing into a position on this chart just yet, this is merely a strong level of indecision for now.
But that rejection off the underside of the trend line does show the power of using these types of levels to daytrade. Strong, obvious levels will give you a reaction more often than not. Use this to your advantage.
Risk Disclosure: In addition to the website disclaimer below, the material on this page prepared by Forex broker Vantage FX Pty Ltd does not contain a record of our prices or solicitation to trade. All opinions, forex news, research, tools, prices or other information is provided as general market commentary and marketing communication – not as investment advice. Consequently, any person acting on it does so entirely at their own risk. The expert writers express their personal opinions and will not assume any responsibility whatsoever for the Forex account of the reader. We always aim for maximum accuracy and timeliness, and FX broker Vantage FX shall not be liable for any loss or damage, consequential or otherwise, which may arise from the use or reliance on this service and its content, inaccurate information or typos. No representation is being made that any results discussed within the report will be achieved, and past performance is not indicative of future performance.

