It’s Friday in the Wall Street Daily Nation!
That means the longwinded analysis is out. (Hallelujah!) And some carefully selected charts are in. (Amen!)
This week, I’m sharing a chart that’s certain to make tax-happy Washingtonians drool.
Then it’s on to the number one reason why China and Japan (yes, Japan!) are the best international markets to invest in right now.
Last, but not least, we’re checking in on the Scariest Jobs Chart Ever. (Hint: It’s getting less scary.)
So without further ado…
Here Come The Spending Cuts And Tax Increases
The “Fiscal Cliff” compromise already jacked up personal income tax rates. But the spendaholics in Washington aren’t done yet.
This time, though, corporations are going to get the squeeze. Here’s why…
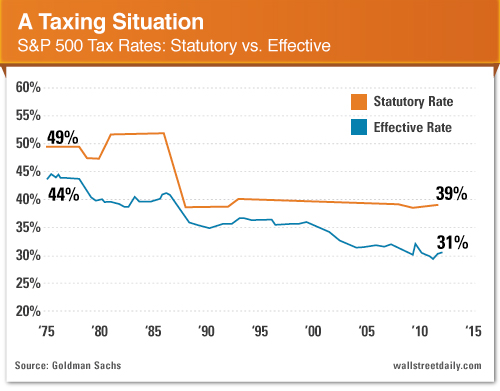
Although the U.S. statutory corporate tax rate rests at 39%, the effective tax rate paid by S&P 500 firms is much lower. It’s currently hovering around 30%.
The cause for the discrepancy? Tax breaks, subsidies and loopholes, of course.
“The tax preferences that create the gap between effective and statutory rates will likely receive scrutiny from policymakers as they attempt to reform the tax code,” says Goldman Sachs’ (GS) David Kostin.
You think, David?
I’ll bet more than a few politicians are drooling over the possibility of eliminating all of these breaks. That way, more tax revenue flows into Washington.
They’ll (hopefully) face reality at some point, though. Taxing more and spending more doesn’t add up to a deficit reduction. Just saying.
Call It A Comeback (Part 1)
File this under the most unexpected bull market in history. (It wasn’t so unexpected for us, though. See here.) 
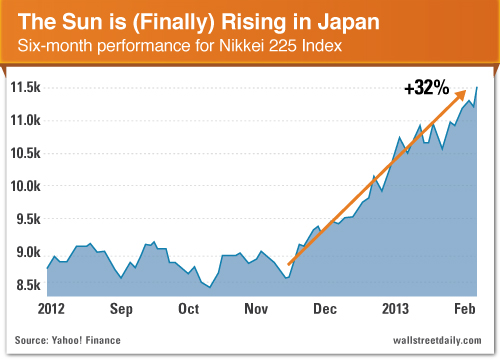
Japan’s Nikkei 225 Index keeps surging off the November lows. If we go by the textbook definition of a bull market (a rise of 20%), then it’s official. Japanese stocks are up 32.3% – and counting.
If you haven’t done so already, you might want to consider entering a position in the WisdomTree Japan Hedged Equity Fund (DXJ), the WisdomTree Japan SmallCap Dividend Fund (DFJ) or the Japan Smaller Capitalization Fund (JOF).
Never say I don’t provide you with options!
Call It A Comeback (Part 2)
File this under “Finally!”
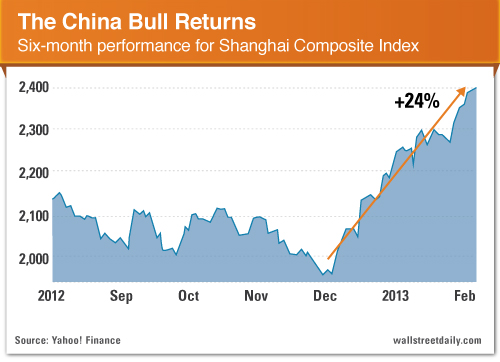
Chinese stocks, which were once the epicenter of emerging markets profits -- then the epicenter of emerging markets losses -- officially got their grove back.
Since early December, the Shanghai Composite Index is up 24.2%.
You’ll recall, a few weeks ago, I shared three ways to capitalize on a new bull market in China.
The Scariest Jobs Chart Ever… Gets Less Scary
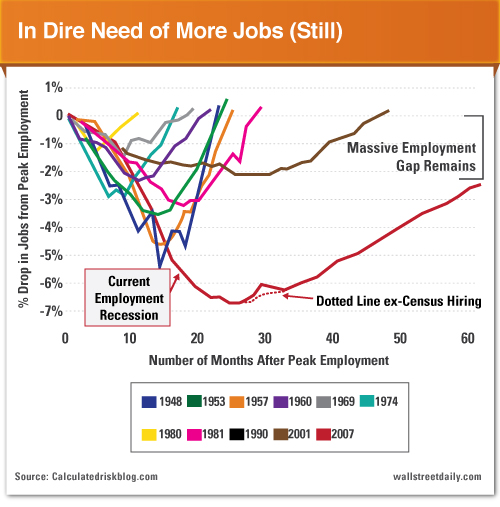
I’ve highlighted the anemic employment recovery in the United States by sharing The Scariest Jobs Chart Ever with you on multiple occasions. And today, it’s time for an update. 
As you can see, job losses from the start of this recession are far from being recouped in percentage terms. So a massive unemployment gap (still) remains. But at least we’re making progress, right?
That’s it for today. Before you sign off, though, do us a favor. Let us know what you think about this weekly column -- or any of our recent work at Wall Street Daily -- by sending an email to feedback@wallstreetdaily.com or leaving a comment below.
Original post
- English (UK)
- English (India)
- English (Canada)
- English (Australia)
- English (South Africa)
- English (Philippines)
- English (Nigeria)
- Deutsch
- Español (España)
- Español (México)
- Français
- Italiano
- Nederlands
- Português (Portugal)
- Polski
- Português (Brasil)
- Русский
- Türkçe
- العربية
- Ελληνικά
- Svenska
- Suomi
- עברית
- 日本語
- 한국어
- 简体中文
- 繁體中文
- Bahasa Indonesia
- Bahasa Melayu
- ไทย
- Tiếng Việt
- हिंदी
Friday Charts: It’s Time to Buy
Published 02/08/2013, 10:50 AM
Updated 05/14/2017, 06:45 AM
Friday Charts: It’s Time to Buy
Latest comments
Loading next article…
Install Our App
Risk Disclosure: Trading in financial instruments and/or cryptocurrencies involves high risks including the risk of losing some, or all, of your investment amount, and may not be suitable for all investors. Prices of cryptocurrencies are extremely volatile and may be affected by external factors such as financial, regulatory or political events. Trading on margin increases the financial risks.
Before deciding to trade in financial instrument or cryptocurrencies you should be fully informed of the risks and costs associated with trading the financial markets, carefully consider your investment objectives, level of experience, and risk appetite, and seek professional advice where needed.
Fusion Media would like to remind you that the data contained in this website is not necessarily real-time nor accurate. The data and prices on the website are not necessarily provided by any market or exchange, but may be provided by market makers, and so prices may not be accurate and may differ from the actual price at any given market, meaning prices are indicative and not appropriate for trading purposes. Fusion Media and any provider of the data contained in this website will not accept liability for any loss or damage as a result of your trading, or your reliance on the information contained within this website.
It is prohibited to use, store, reproduce, display, modify, transmit or distribute the data contained in this website without the explicit prior written permission of Fusion Media and/or the data provider. All intellectual property rights are reserved by the providers and/or the exchange providing the data contained in this website.
Fusion Media may be compensated by the advertisers that appear on the website, based on your interaction with the advertisements or advertisers.
© 2007-2025 - Fusion Media Limited. All Rights Reserved.
