Natural gas futures tumbled more than 3% after a report showed U.S. gas stockpiles last week rose more than expected, underscoring sluggish demand for the fuel. Inventories of natural gas, used primarily for heating and electricity, rose 99 billion cubic feet last week, outpacing the 95-bcf expected by analysts surveyed by Dow Jones Newswires. The rise suggests demand for heating was weaker than projected last week, as milder temperatures overtake much of the U.S. Natural gas for June delivery Thursday declined 13.3 cents, or 3.3%, to $3.937 a million British thermal units on the New York Mercantile Exchange.

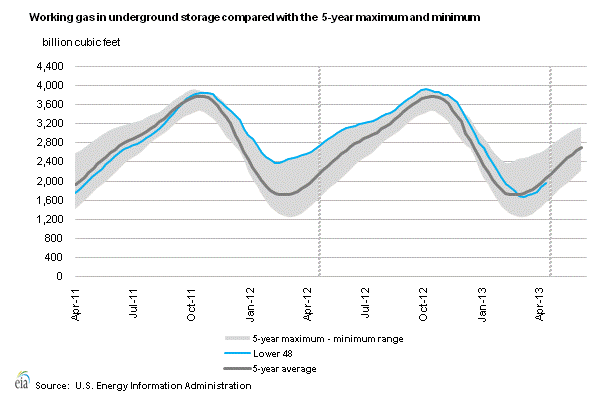
Working gas in storage was 1,964 Bcf as of Friday, May 10, according to EIA estimates. This represents a net increase of 99 Bcf from the previous week. Stocks were 694 Bcf less than last year at this time and 83 Bcf below the five-year average of 2,047 Bcf. In the East Region, stocks were 105 Bcf below the five-year average following net injections of 55 Bcf. Stocks in the Producing Region were 29 Bcf below the five-year average of 825 Bcf after a net injection of 31 Bcf. Stocks in the West Region were 51 Bcf above the 5-year average after a net addition of 13 Bcf. At 1,964 Bcf, total working gas is within the five-year historical range.
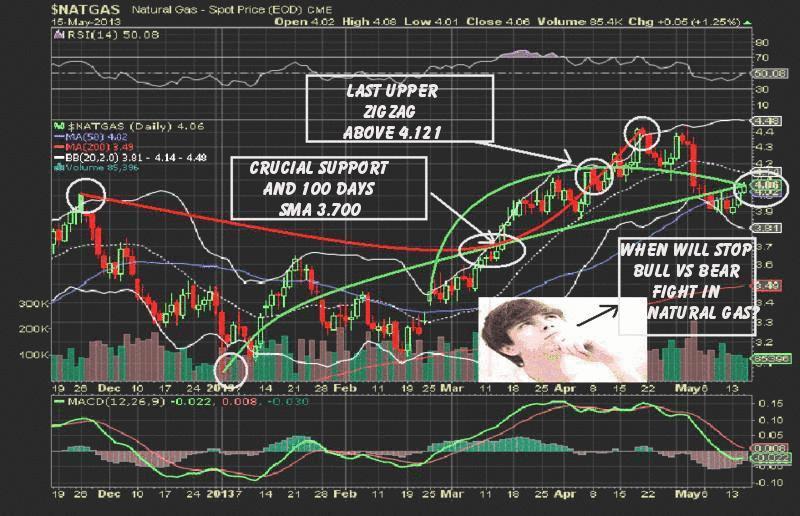
In our last Natural gas post we gave 3.880 as a crucial support. NG never breaks 3.880 and has created a low of 3.880. Given 4.106 as crucial resistance, it’s not at a cross yet. On the semiannual chart, natural gas creates a rectangle triangle in up trend, indicating that the natural-gas long-term bullish trend will continue near crucial support at 3.700.
On the semiannual chart, the last upper zigzag was created around 4.121 so you can focus on 4.121 as a near-main resistance. You can set upper-sell targets of 4.190 and 4.300 if natural gas crosses its crucial resistance of 4.121 and closes on it. The six-month MACD and RSI also display positive on the semiannual chart. If the market sustains at 3.990, don’t take any short positions. Short-term traders should buy around support and sell around resistance with strict stop loss.
- English (UK)
- English (India)
- English (Canada)
- English (Australia)
- English (South Africa)
- English (Philippines)
- English (Nigeria)
- Deutsch
- Español (España)
- Español (México)
- Français
- Italiano
- Nederlands
- Português (Portugal)
- Polski
- Português (Brasil)
- Русский
- Türkçe
- العربية
- Ελληνικά
- Svenska
- Suomi
- עברית
- 日本語
- 한국어
- 简体中文
- 繁體中文
- Bahasa Indonesia
- Bahasa Melayu
- ไทย
- Tiếng Việt
- हिंदी
Friday's Technicals On Natural Gas
Published 05/17/2013, 10:47 AM
Updated 07/09/2023, 06:32 AM
Friday's Technicals On Natural Gas
Latest comments
Loading next article…
Install Our App
Risk Disclosure: Trading in financial instruments and/or cryptocurrencies involves high risks including the risk of losing some, or all, of your investment amount, and may not be suitable for all investors. Prices of cryptocurrencies are extremely volatile and may be affected by external factors such as financial, regulatory or political events. Trading on margin increases the financial risks.
Before deciding to trade in financial instrument or cryptocurrencies you should be fully informed of the risks and costs associated with trading the financial markets, carefully consider your investment objectives, level of experience, and risk appetite, and seek professional advice where needed.
Fusion Media would like to remind you that the data contained in this website is not necessarily real-time nor accurate. The data and prices on the website are not necessarily provided by any market or exchange, but may be provided by market makers, and so prices may not be accurate and may differ from the actual price at any given market, meaning prices are indicative and not appropriate for trading purposes. Fusion Media and any provider of the data contained in this website will not accept liability for any loss or damage as a result of your trading, or your reliance on the information contained within this website.
It is prohibited to use, store, reproduce, display, modify, transmit or distribute the data contained in this website without the explicit prior written permission of Fusion Media and/or the data provider. All intellectual property rights are reserved by the providers and/or the exchange providing the data contained in this website.
Fusion Media may be compensated by the advertisers that appear on the website, based on your interaction with the advertisements or advertisers.
© 2007-2025 - Fusion Media Limited. All Rights Reserved.
