Another Bank remains on hold
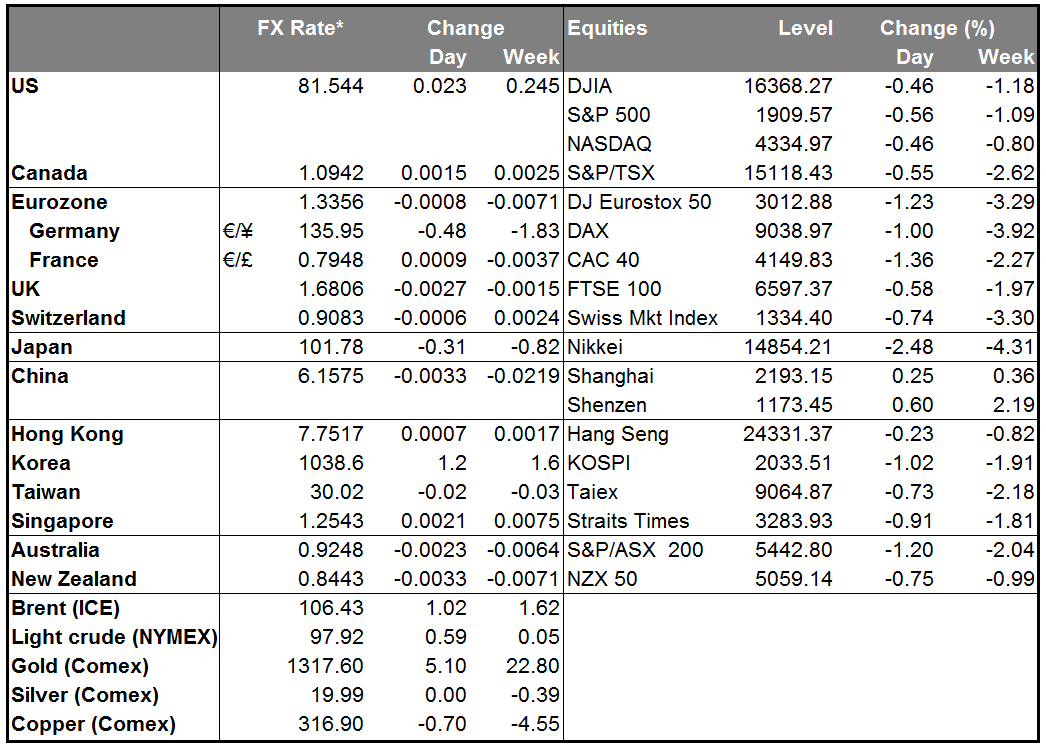
The Bank of Japan ended its two-day policy meeting overnight, and it too made no change in policy, as expected. In its statement, the Bank said that Japan’s economy has continued to recover moderately and that inflation expectations appear to be rising on the whole. As for the indicators, the country’s current account surplus fell to JPY 125bn in June on a seasonally adjusted basis, from JPY 384bn, more or less in line with expectations of a decrease to JPY110bn. I think the BoJ under Gov. Kuroda is being overly optimistic. It seems from the data that inflation is once again subsiding, and with exports languishing and the current account surplus gradually disappearing, I expect that the authorities may feel the need to take steps later in the year to weaken the yen.
US President Barack Obama authorized targeted air strikes against Islamic militants in Iraq, the first since the nation’s pullout of troops in 2011. The authorization came after the US military began the delivery of humanitarian relief in the form of air drops by US jets. Oil prices rose after the announcement, amid expectations that oil supplies from Iraq may be interrupted. Nevertheless, we believe that the actual airstrike is needed to see the oil prices go further up. Safe haven assets such as gold and JPY also strengthened after the President’s authorization, leading us again to a risk-off environment.
On Thursday, the ECB Governing council decided to keep policy unchanged, as expected. At the press conference following the meeting, ECB President Mario Draghi repeated that the Bank will keep rates low for an extended period of time in view of the current outlook for inflation. Draghi also said that the ECB has hired a consultant to design an ABS purchase programme (or quantitative easing by any other name). This has been done with the expectation of using it but no final decision has been taken. They will use QE if the medium-term outlook changes.
Draghi also said that he sees a significant rise in short Euro positions and that the fundamentals for a weaker exchange rate are much better. He also added that markets observe divergent rate paths in the euro-area and the US. We certainly do! In fact this has been the driving force behind our view that EUR/USD is likely to trend lower Such comments only add to our conviction.
Today: During the European day, the only indicators worth mentioning are Germany’s trade and current account surpluses, which are expected to increase in June. French industrial production for June is also coming out and the forecast is for the figure to show a rebound.
In the UK, the trade balance for June is coming out and the forecast is for the deficit to have narrowed a bit
No major data is due from the US.
From Canada, the point of interest will be the unemployment rate for July, which is estimated to have remained unchanged at 7.1%. However, the change in employment for the same month is expected to turn to positive again. For the last couple of months the employment figure have been switching from positive to negative and vice versa. If this pattern continues and the release beats the estimate, we will most likely see CAD strengthening like the previous times.
The Market
EUR/USD near Wednesday’s lows
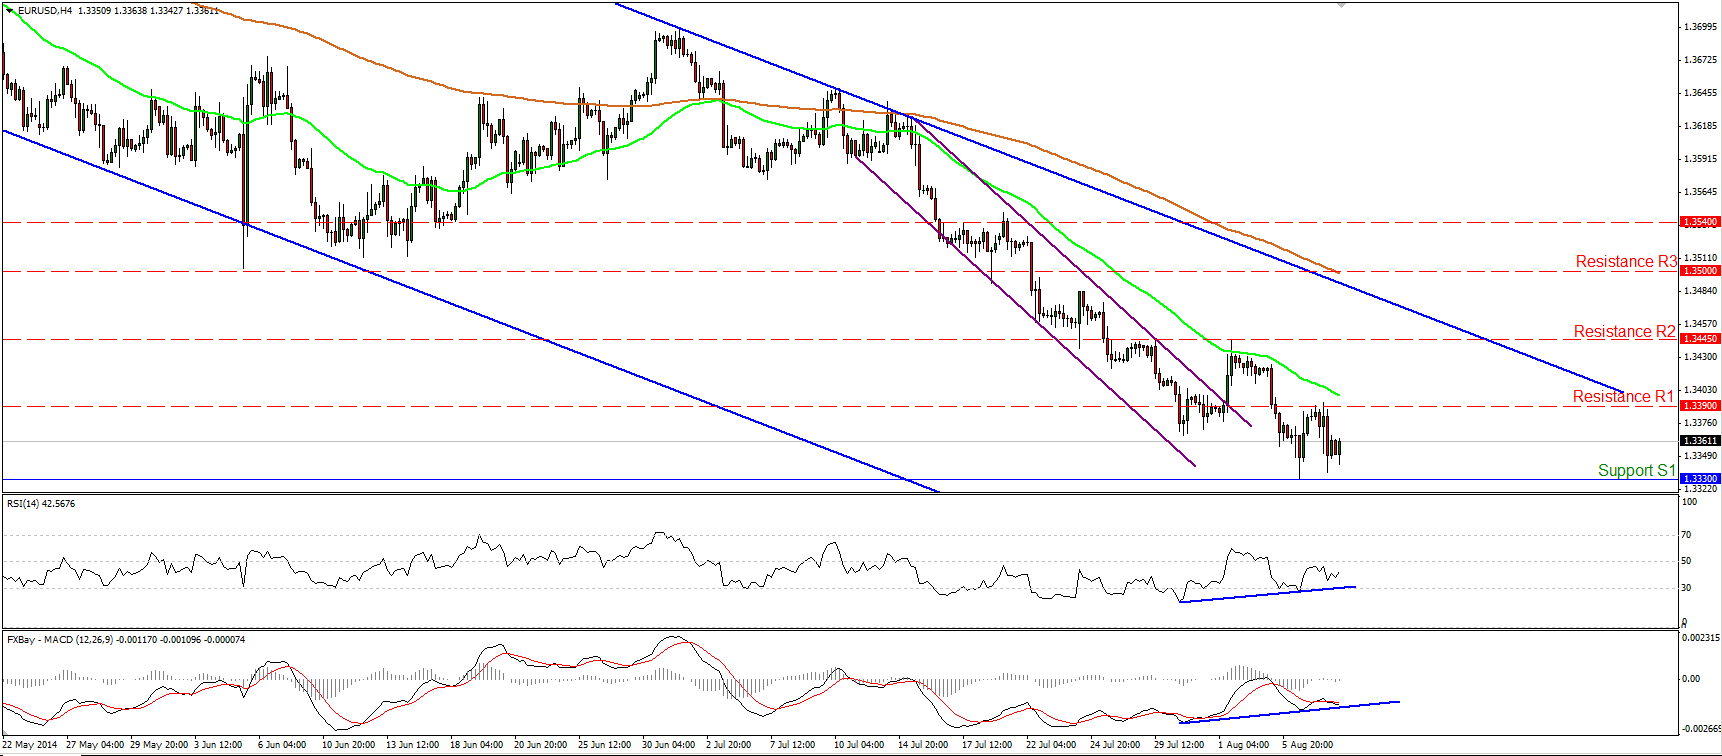
EUR/USD declined on Thursday, to find support marginally above Wednesday’s lows of 1.3330 (S1). I will stick to the view that the overall picture of the pair remains negative, since the rate is trading within the long-term blue downside channel, connecting the highs and the lows on the daily chart. Nevertheless, taking a look on the 4-hour chart, I still see positive divergence between the price action and both our momentum studies. Having that in mind, I would be cautions for another upside corrective move before sellers take the reins again and I would remain to the sidelines at the moment, until both oscillators confirm the downtrend. A dip below 1.3300 (S2) is needed to pull the trigger for further downside extensions, perhaps towards the 1.3200 (S3) zone.
• Support: 1.3330 (S1), 1.3300 (S2), 1.3200 (S3).
• Resistance: 1.3390 (R1), 1.3445 (R2), 1.3500 (R3).
EUR/JPY collapses
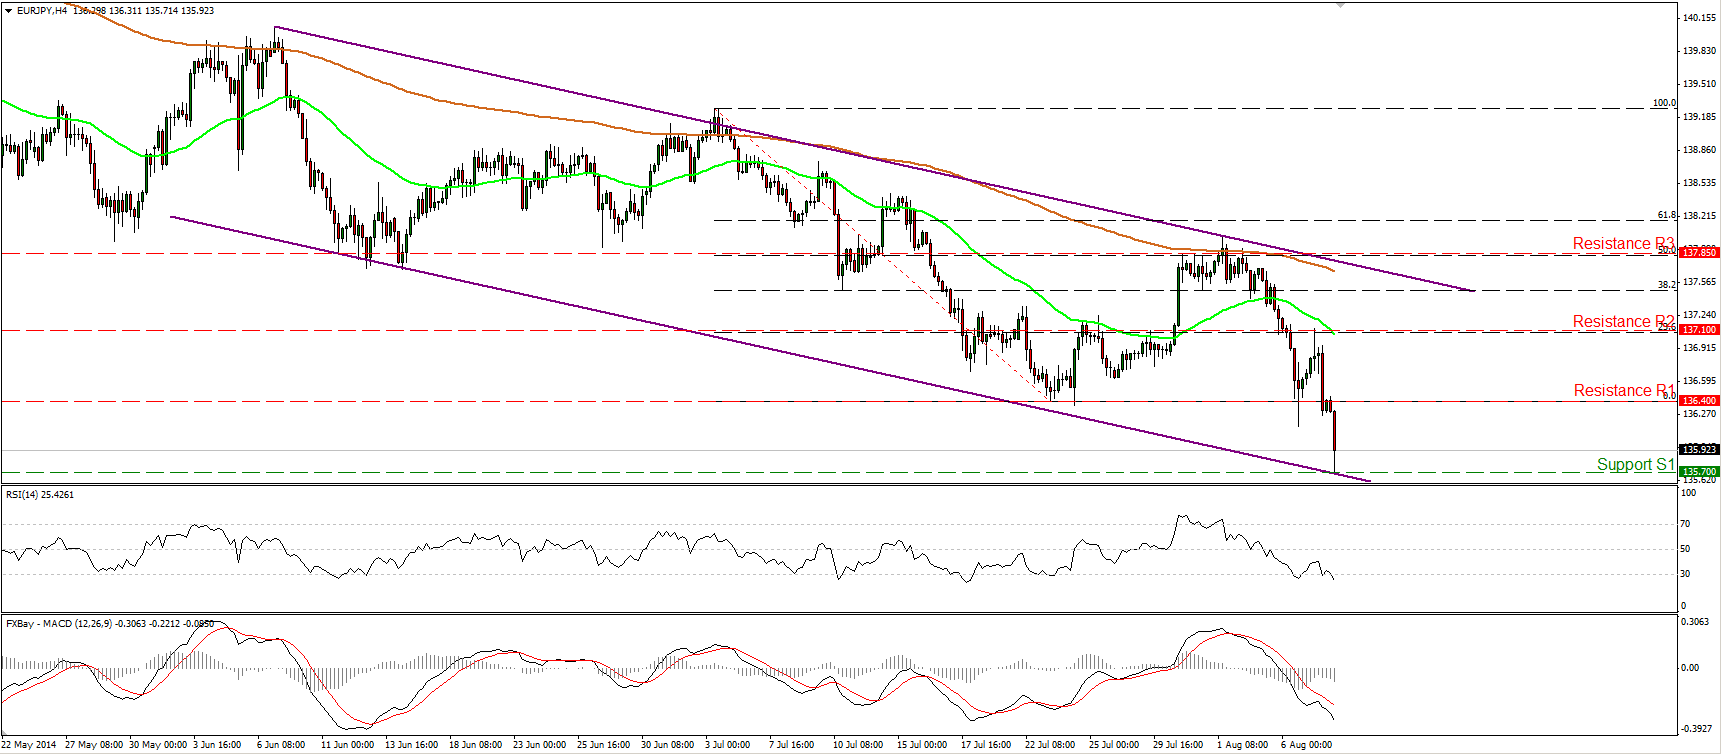
EUR/JPY plunged after finding resistance at the 50% retracement level of the 3rd - 23rd July down wave, at 137.85 (R3), which also coincides with the 200-day moving average. Nevertheless, the fall was halted by the lower bound of the purple downside channel and the 135.70 (S1) barrier. The next support lies at 135.50 (S2), where a decisive violation could have larger bearish implications and could pave the way towards the 134.00 (S3) area. As long as the rate remains within the channel, the overall path remains to the downside, but given our proximity to the lower line of the channel, we may experience an upside corrective move before the bears prevail again.
• Support: 135.70 (S1), 135.50 (S2), 134.00 (S3).
• Resistance: 136.40 (R1), 137.10 (R2), 137.85 (R3).
GBP/USD touches 1.6800
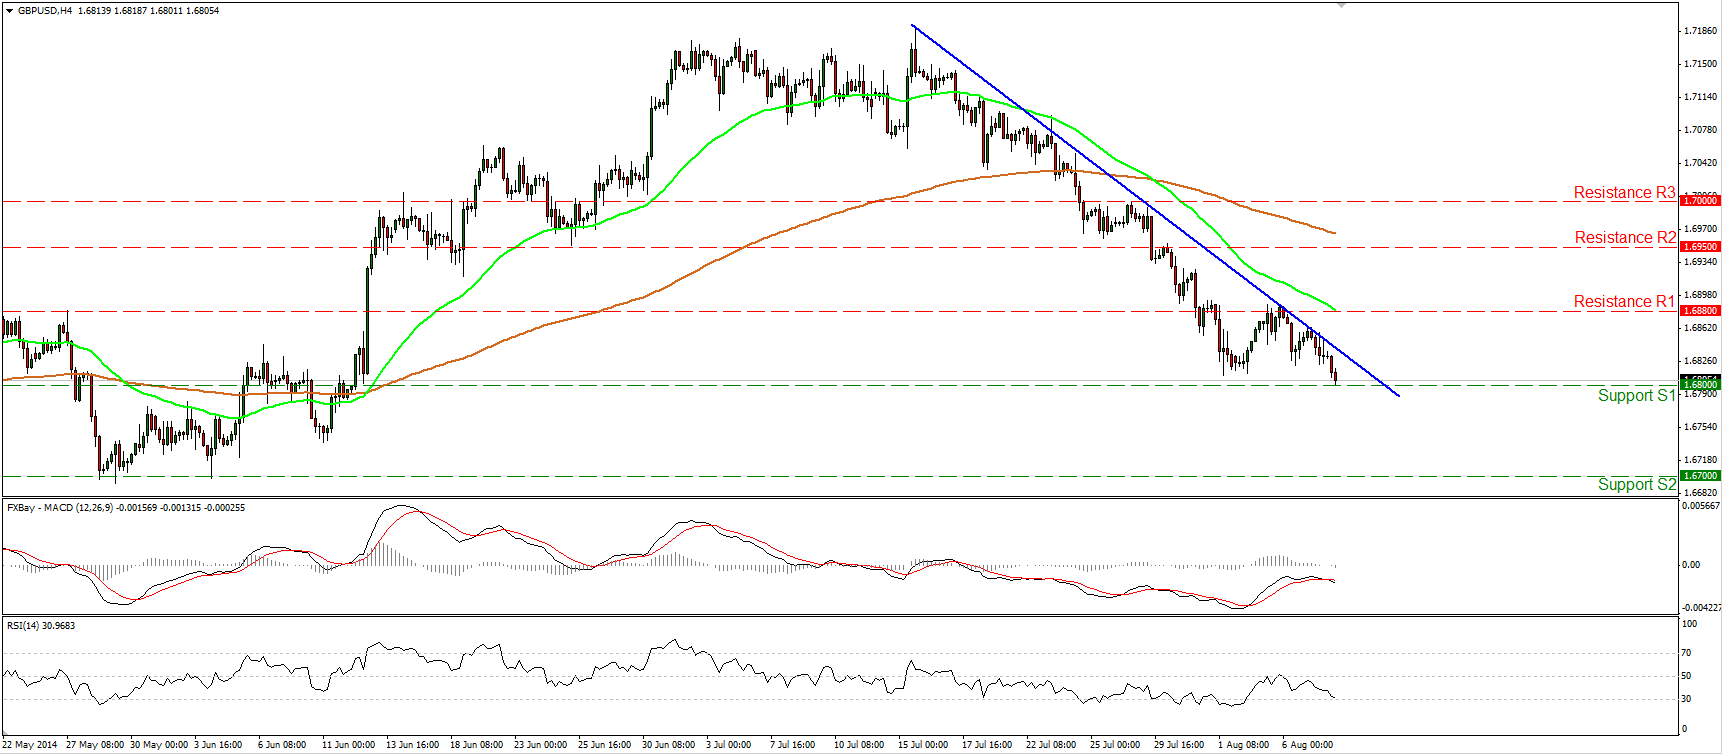
GBP/USD declined after finding resistance once again at the blue downtrend line, drawn from back the highs of the 15th of July. The rate reached our support barrier of 1.6800 (S1) and if the bears manage to overcome it, I would expect them to drive the battle towards our next support zone of 1.6700 (S2). The MACD, already in its negative field, moved below its signal line, confirming the recent negative momentum of the price action. As long as the rate is printing lower lows and lower highs below the trend line and below both the moving averages, I still see a negative short-term picture. On the daily chart, Cable remains below the 80-day exponential moving average, amplifying the case for further bearish extensions in the near future.
• Support: 1.6800 (S1), 1.6700 (S2), 1.6655 (S3).
• Resistance: 1.6880 (R1), 1.6950 (R2), 1.7000 (R3).
Gold above the 200-day EMA
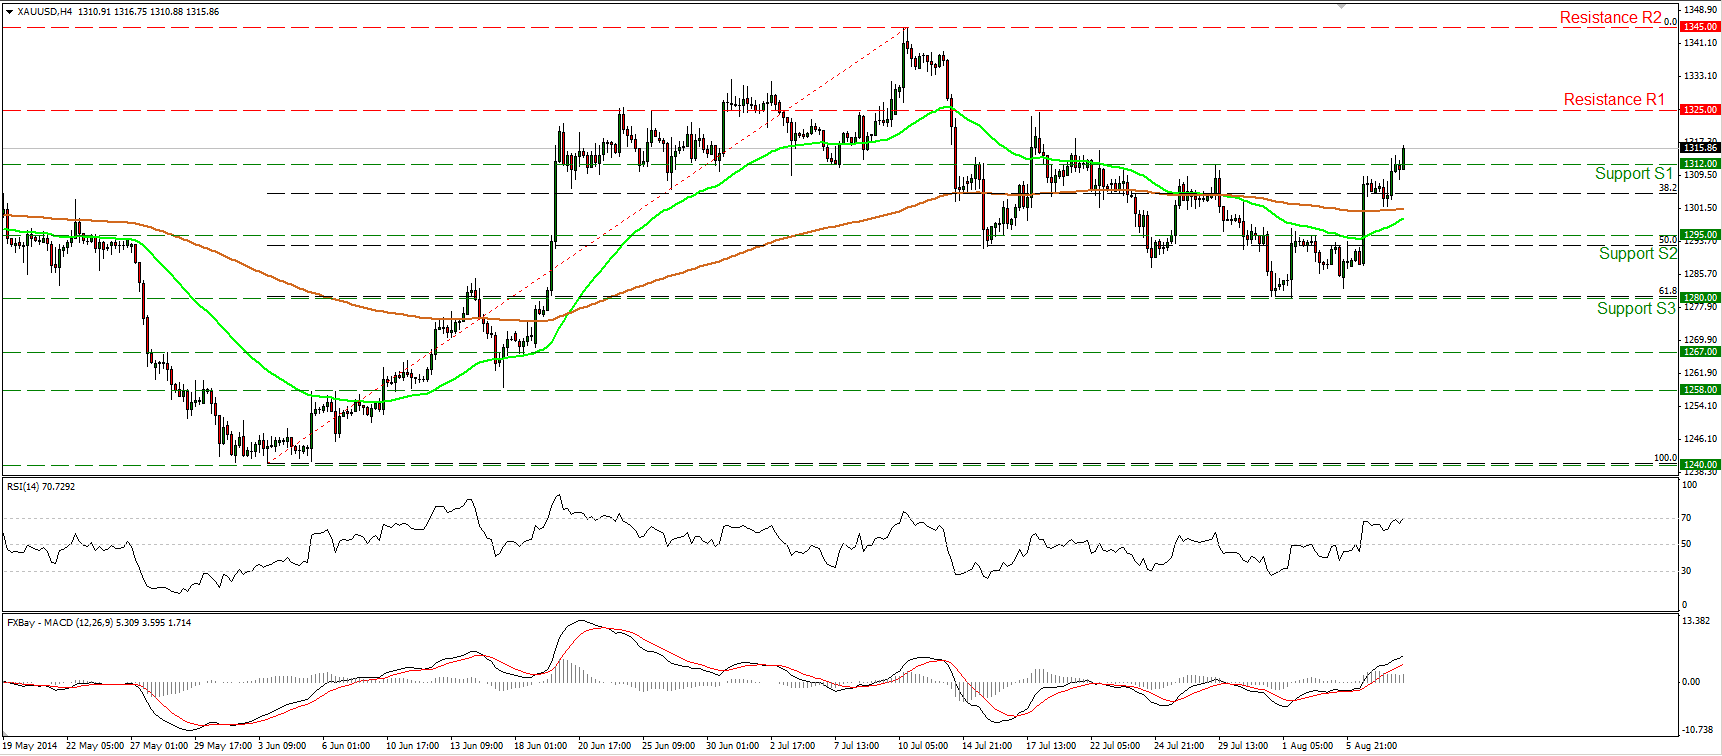
Gold continued moving higher yesterday, breaking above the obstacle of 1312 (prior resistance turned into support). Such a move confirms that the 10th- 31st July decline was just a 61.8% correction of the 3rd June – 10th July uptrend and could target the next resistance level at 1325 (R1). A decisive move above that hurdle is likely to set the stage for extensions towards the highs of the 10th of July at 1345 (R2). On the daily chart, the 14-day RSI moved higher after crossing above its 50 line, while the MACD crossed above its signal line and seems ready to obtain a positive sign. Also, the price moved above the 200-day moving average, corroborating my view that the yellow metal is likely to continue higher in the near future.
• Support: 1312 (S1), 1295 (S2), 1280 (S3).
• Resistance: 1325 (R1), 1345 (R2), 1355 (R3) .
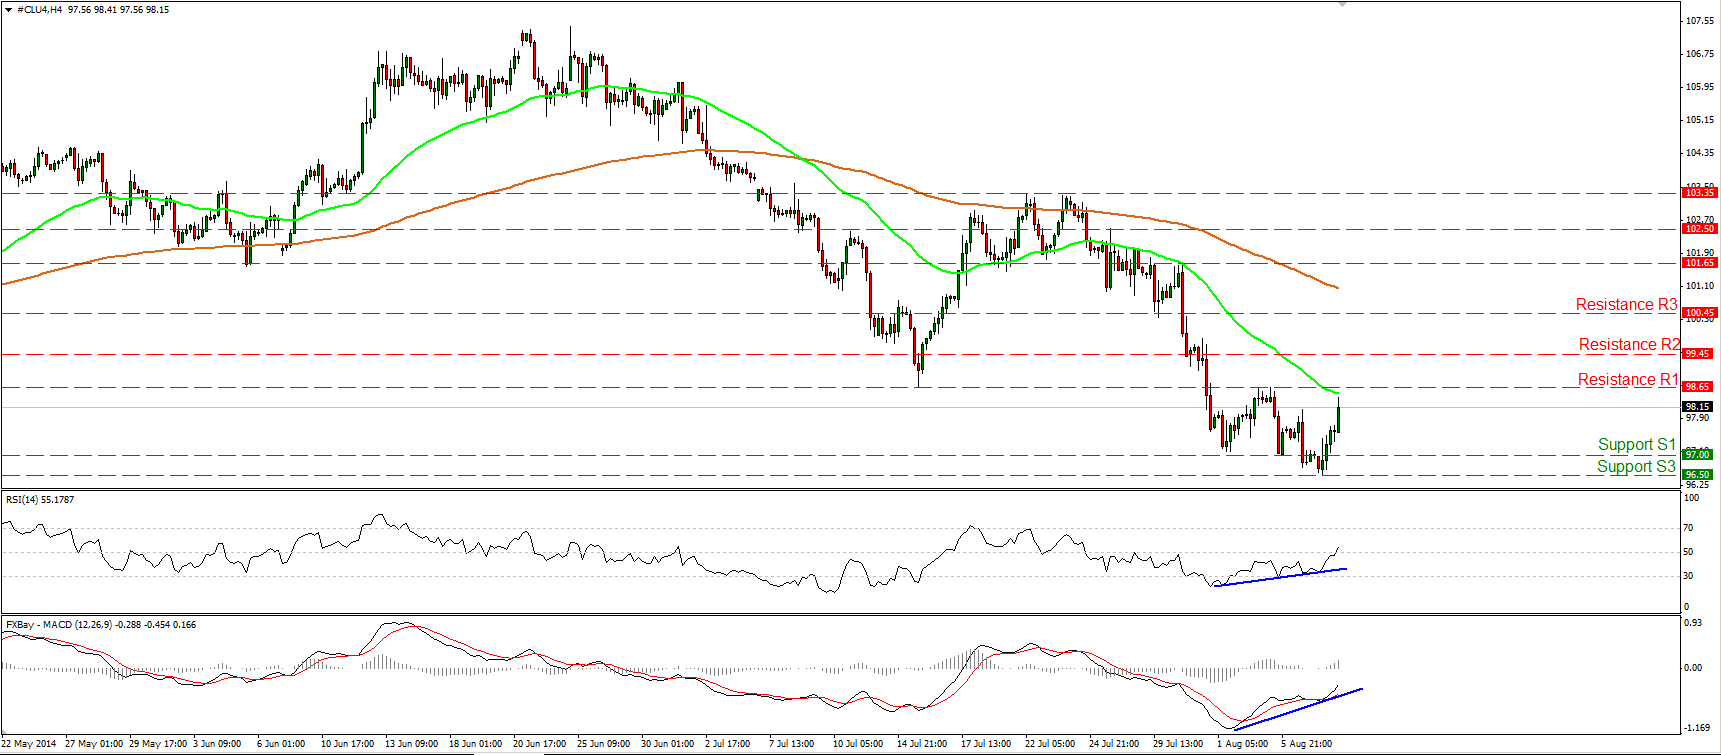
WTI rebounds back above 97.00
WTI rebounded from just below 97.00 and rallied to trade near our resistance bar of 98.65 (R1). This confirms my choice to maintain my neutral view, despite the dip below the key 97.00 barrier, as we had positive divergence between our oscillators and the price action. Now, the RSI moved above its 50 line and is pointing up, while the MACD, although negative, crossed above its signal line and is also pointing up. Furthermore, on the daily chart, the 14-day RSI rebounded near its 30 line, while the daily MACD shows signs of bottoming. Considering these momentum signs, I will keep my flat stance, since I cannot rule out the continuation of the upside corrective move.
• Support: 97.00 (S1), 96.50 (S2), 95.85 (S3).
• Resistance: 98.65 (R1), 99.45 (R2), 100.45 (R3).

