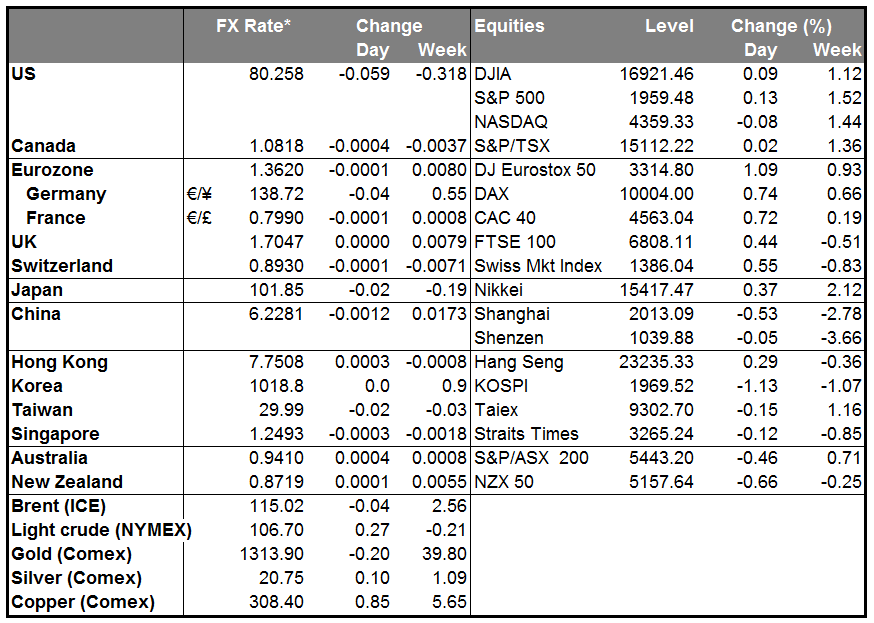
Gold, Silver jump After weeks of trading quietly, gold and silver jumped yesterday, with gold rising 2.8% and silver exploding 4.5% in heavy volume. Reasons quoted on the screens included thoughts that Fed would keep rates low for a long time and the fall in the dollar, although the 4.5 bps drop in the implied interest rate on Fed Funds futures yesterday was hardly enough to justify the sharp rise in the precious metal prices. President Obama’s decision to send some soldiers to Iraq as “military advisors” may also have had something to do with it. In the background, the unwind of China’s commodity financing deals may be helping to boost the price of gold as Chinese speculators sell their physical gold and at the same time buy back their hedges in the futures market. This mechanism assumes that the paper market dominates the pricing of gold rather than the physical market, which seems possible given the difference in volumes. The effect would probably be the opposite in other commodity markets affected by the Chinese financing deals however, such as iron ore and copper.
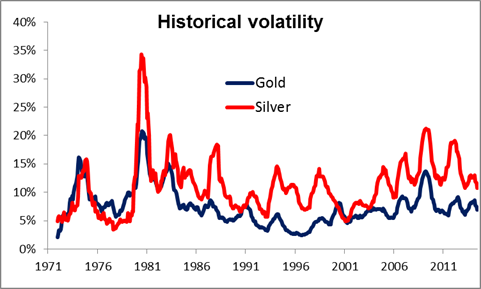
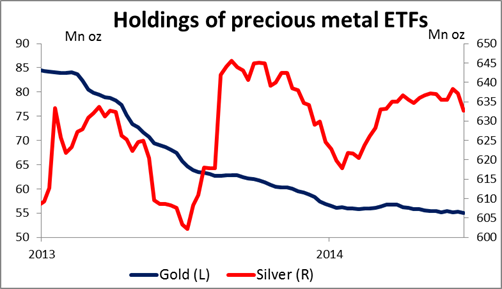
Silver’s marked outperformance is no accident. First off, it has historically been more volatile than gold, so naturally it should outperform on the upside just as it has underperformed recently on the downside. Secondly, positioning is extremely short – according to the Commitment of Traders report, speculative investors were essentially flat at the beginning of June, the shortest they’ve been since 2003 (indeed, if we include option positions, they were net short). Gold investors continue to be long however, with recent positioning ranking around the 20th percentile for the last two years (that is to say, speculative investors had larger long positions over that period for about 80% of the time for gold, as opposed to 100% of the time for silver). On the other hand, silver exchange traded funds (ETFs) have seen a net inflow of 1.6% so far this year, while gold ETFs have seen a net outflow of 2.8%. That suggests retail is still bullish on silver, which may provide an underpinning of demand for the white metal.
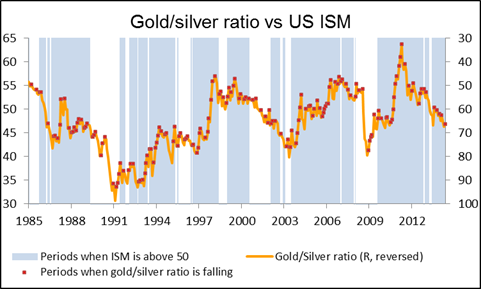
Finally, it’s usual for silver to outperform gold when US manufacturing is expanding, as shown by the Institute of Supply Management (ISM) index being above 50. That’s because silver has many more industrial uses than gold does.
It seems likely to me that if tensions in Iraq rise further, precious metals may continue to rise and in that case, silver should outperform gold, in my view.
As for the FX market, the dollar fell against most of the G10 currencies. The biggest gainer was CHF, which may be an indication that risk aversion was dominating the FX market. That would also explain why the dollar gained against most EM currencies despite expectations of lower US rates and the post-FOMC fall in the VIX index of expected volatility. Low volatility is good for carry trades, so I had expected the fall in the VIX index to encourage flows into high-yielding EM currencies, but apparently the fears of a worsening crisis in the middle east and higher oil prices were dominating the market yesterday. That might also explain why the petrocurrency RUB was the best-performing currency overnight. The worst-performing one was the NOK, which plunged after the Norges Bank revised down its rate path yesterday and failed to recover any ground overnight.
During the European day, Germany’s PPI rate is forecast to have declined 0.7% yoy in May, compared with -0.9% yoy in April. We also get Italy’s industrial orders for April and Eurozone’s preliminary consumer confidence indicator. Neither release is a major market mover.
In Canada, the headline CPI for May is estimated to have remained unchanged at +2.0% yoy and the core CPI to quicken slightly to +1.5% yoy from +1.4% yoy. Furthermore, nation’s retail sales are expected to rise 0.6% mom for April from -0.1% in the previous month. These would tend to be CAD-positive.
As for speakers, ECB Executive Board member Yves Mersch speaks in Brussels.
The Market
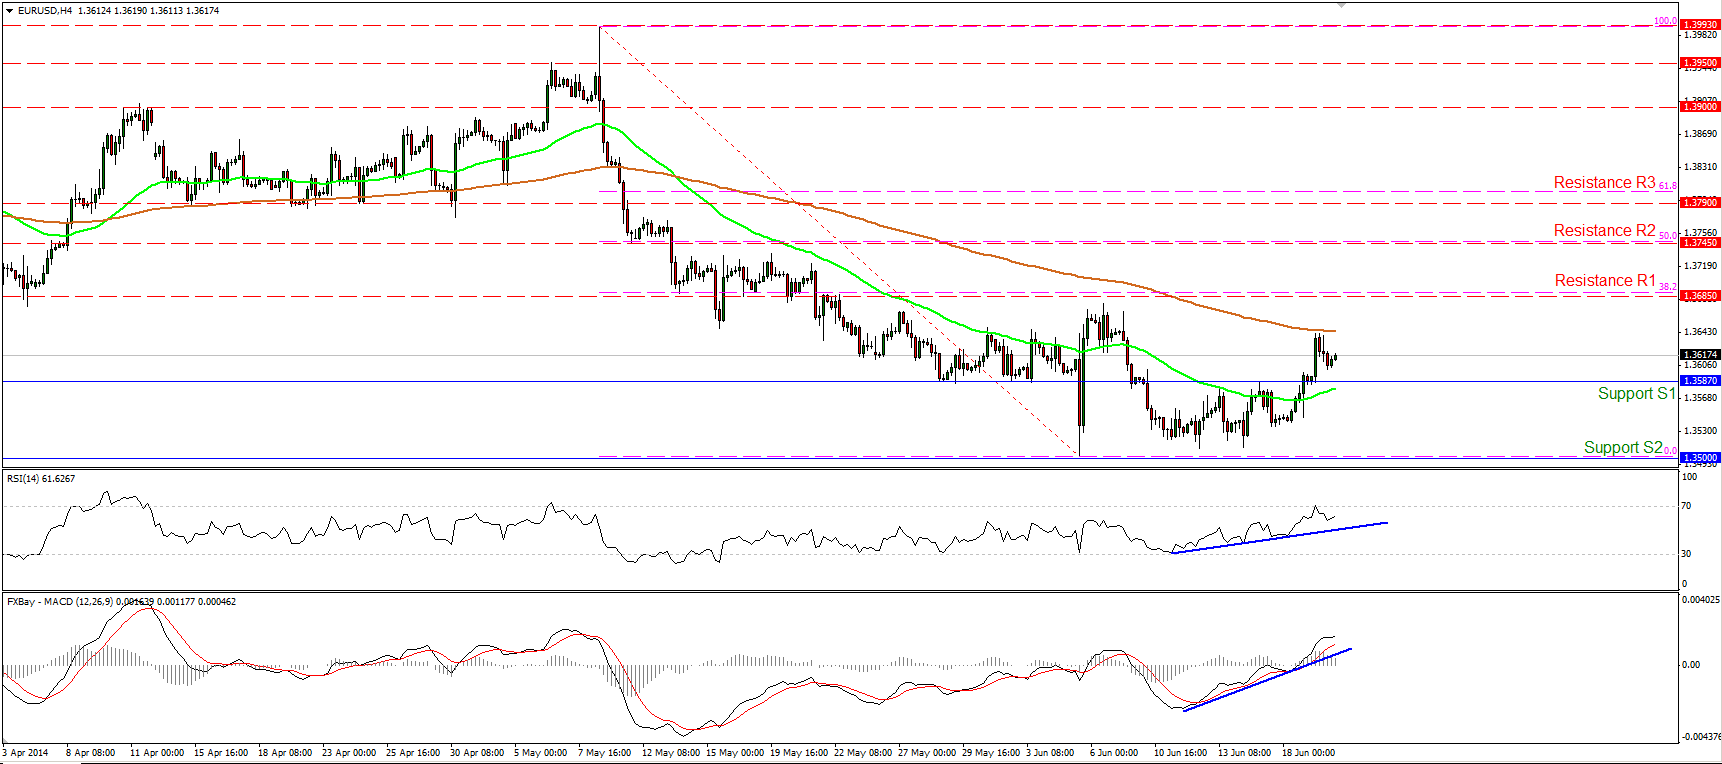
EUR/USD still in a retracing mode
EUR/USD continued moving higher after breaking above the 1.3587 barrier, but the advance was stopped by the 200-period moving average. Considering that both our momentum studies continue their upside paths, I still expect the rate to challenge the 1.3685 (R1) zone, which coincides with the 38.2% retracement level of the 8th May- 5th June decline. In the bigger picture, we can identify positive divergence between the 14-day RSI and the price action, while the daily MACD crossed above its trigger line. This increases the likelihood for the continuation of the bullish wave. However, the long-term picture remains to the downside and I would consider any further advance as a retracement for now.
• Support: 1.3587 (S1), 1.3500 (S2), 1.3475 (S3).
• Resistance: 1.3685 (R1), 1.3745 (R2), 1.3745 (R3).
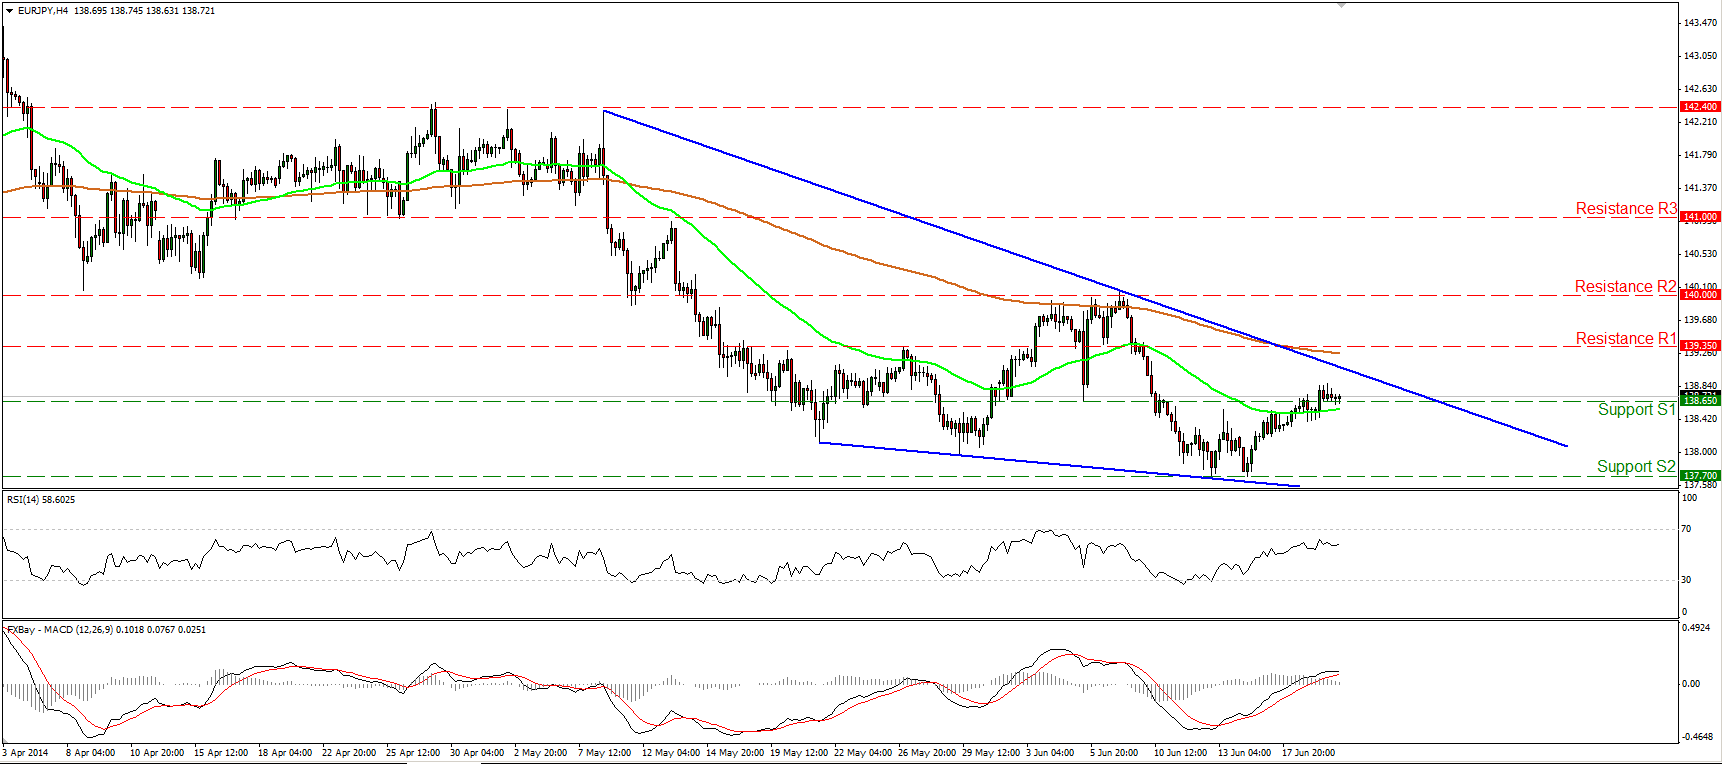
EUR/JPY slightly above 138.65
EUR/JPY inched above the 138.65 hurdle. Seeing that our momentum studies shows signs of decelerating bullish momentum, I would expect further consolidation near that zone and I could not rule out a move back below 138.65 again. In the bigger picture, the rate is trading within a possible falling wedge formation, thus I would maintain my neutral view. Only a decisive move out of the pattern could give clearer indications about the forthcoming direction of the rate.
• Support: 138.65 (S1), 137.70 (S2), 100.80 (S3).
• Resistance: 139.35 (R1), 140.00 (R2), 141.00 (R3).
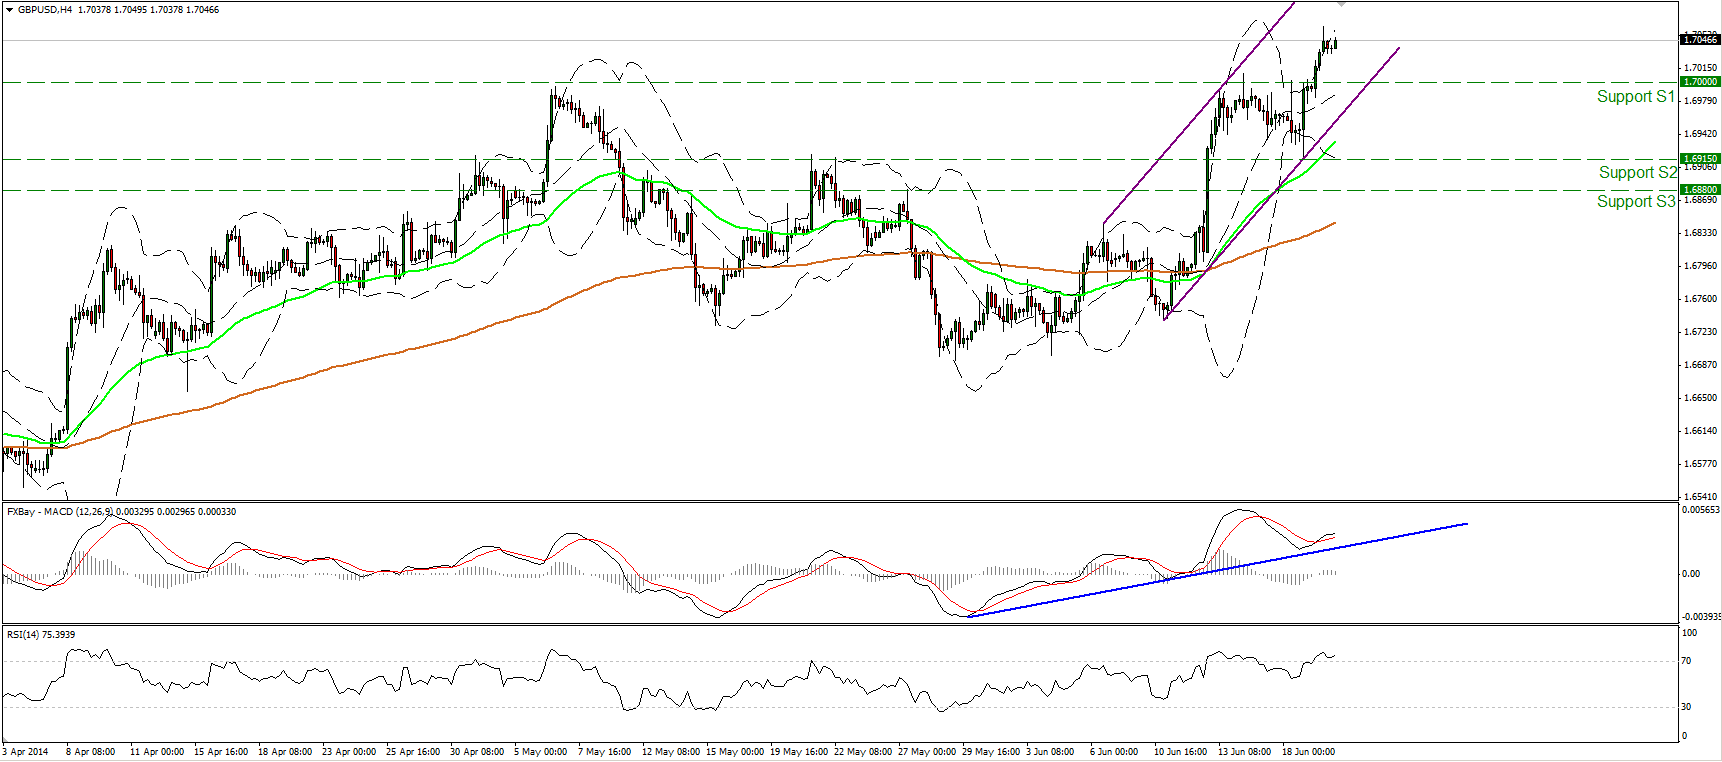
GBP/USD sustains its rate above 1.7000
GBP/USD moved higher on Thursday, breaking above the psychological barrier of 1.7000 and confirming a forthcoming higher high. I would expect such a move to have larger bullish implications and see as a first target the 1.7100 zone. The MACD, already in bullish territory, crossed above its trigger line, confirming the accelerating momentum of the price action. I would ignore the overbought reading of RSI since the indicator does not seem willing to exit extreme conditions. As long as cable is forming higher highs and higher lows within the purple upside channel and above both the moving averages, I see a positive picture. On the daily chart, the 80-day exponential moving average provides significant support to the lows of the price action, keeping the long-term upside path intact.
• Support: 1.7000 (S1), 1.6915 (S2), 1.6880 (S3).
• Resistance: 1.7100 (R1), 1.7200 (R2), 1.7300 (R3).
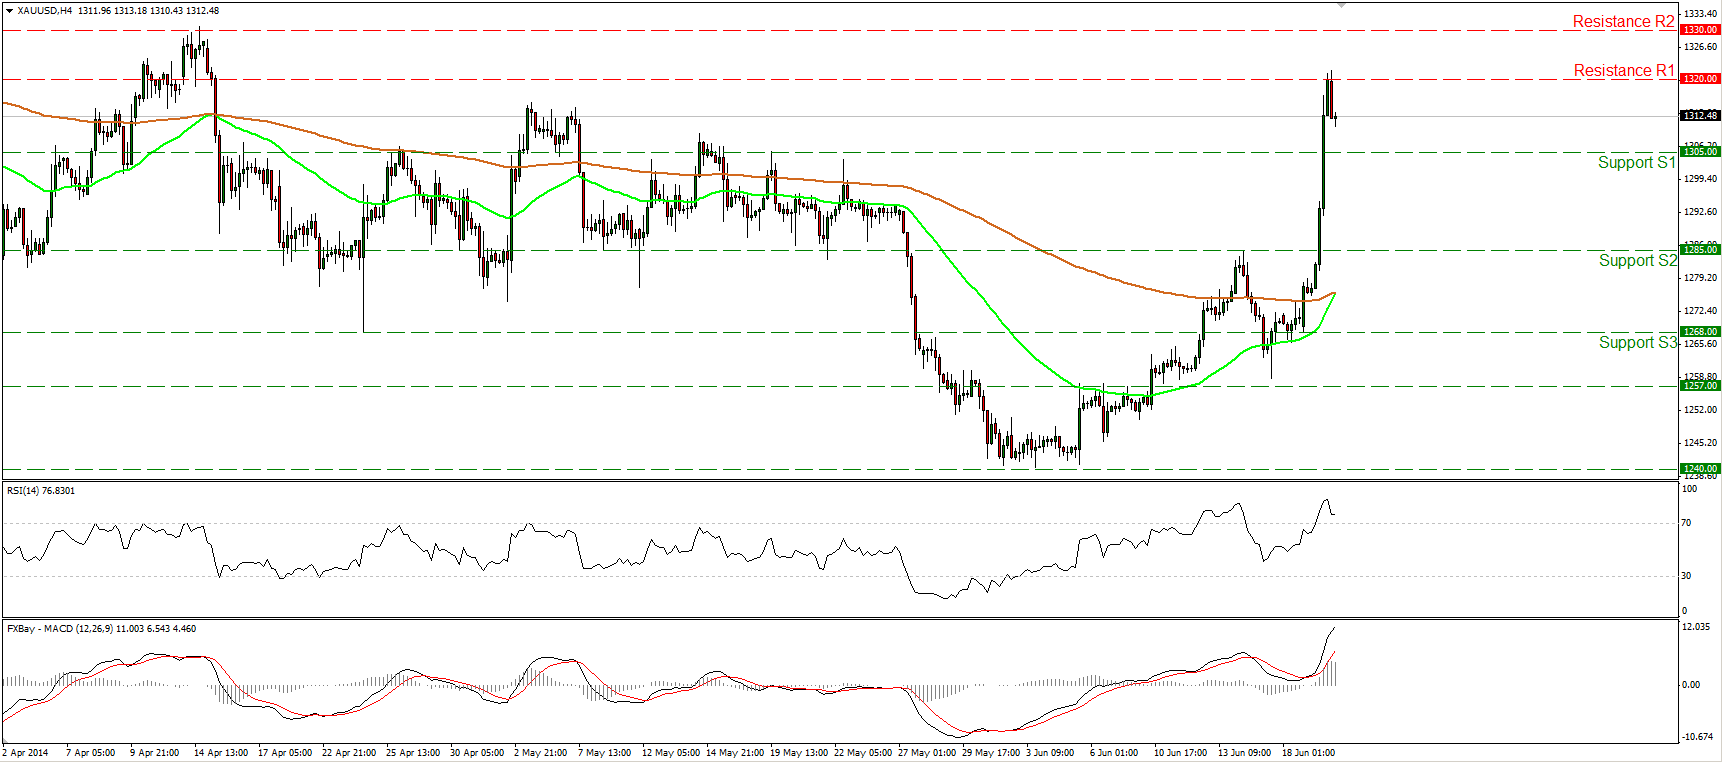
Gold shoots up to 1320
Gold surged yesterday, breaking two resistance barriers in a row. The rally of the precious metal was halted near the 1320 (R1) zone. A move above that resistance may see the next one at 1330 (R2). The move above the 1285 barrier confirmed a forthcoming higher high and turned the short-term picture of the metal positive. Nonetheless, considering that the RSI shows signs of topping within its overbought territory, I cannot rule out some price consolidation or a pullback before the longs take control again.
• Support: 1305 (S1), 1285 (S2), 1268 (S3).
• Resistance: 1320 (R1), 1330 (R2), 1342 (R3).
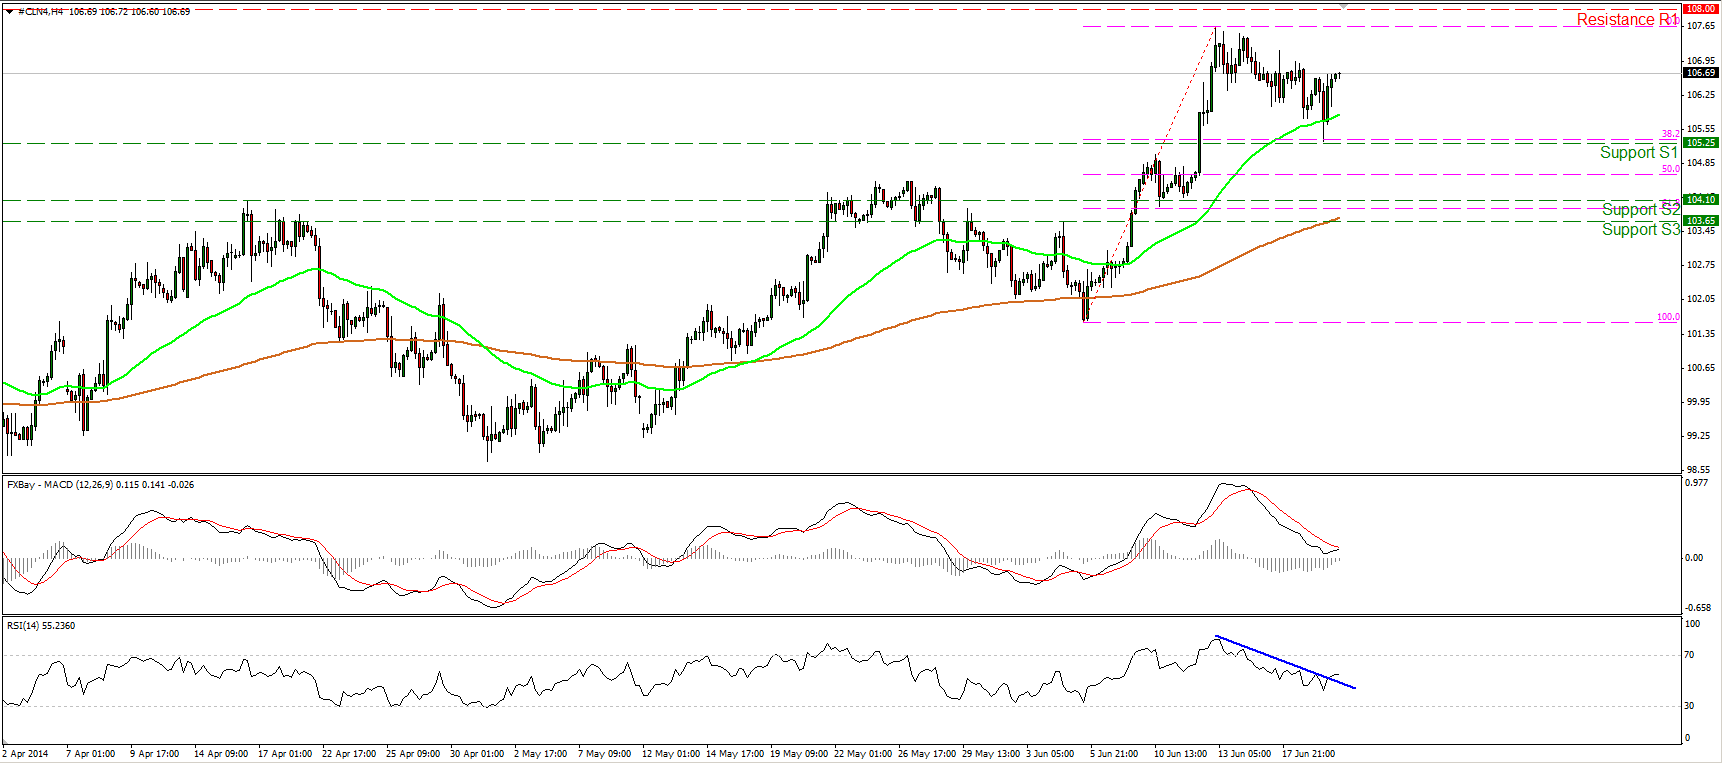
Has WTI completed its correction?
WTI moved higher after finding support at the 38.2% retracement level of the 5th June – 13th June rally, at 105.25 (S1). The RSI moved above its blue downtrend line, while the MACD seems ready to cross above its signal line. As a result, I believe that the correction phase is over and we could experience a move towards the 108.00 (R1) resistance zone. A clear move above that zone is likely to trigger extensions towards the 110.00 (R2) area. As long as we see a structure of higher highs and higher lows, I consider the upside path to remain intact.
• Support: 105.25 (S1), 104.10 (S2), 103.65 (S3).
• Resistance: 108.00 (R1), 110.00 (R2), 112.00 (R3).

